

The complete solution for demonstrating the blackbody spectrum of light intensity for a light bulb. Great for qualitative analysis.
See the Product Description for this item's included accessories.
See the Buying Guide for this item's required, recommended, and additional accessories.
Product Summary
In this experiment designed for use with PASCO Capstone software, the classic blackbody spectrum of light intensity versus wavelength is obtained for a light bulb and the shift in the peak wavelength is demonstrated for different bulb temperatures.
The spectrum of an incandescent light bulb is scanned by hand using a prism spectrophotometer, which measures relative light intensity as a function of angle. A Broad Spectrum Light Sensor is used with a prism so the entire spectrum from approximately 400 nm to 2500 nm can be scanned without the overlapping orders caused by a grating. The wavelengths corresponding to the angles are calculated using the equations for a prism spectrophotometer. The relative light intensity can then be plotted as a function of wavelength as the spectrum is scanned, resulting in the characteristic blackbody curve. The intensity of the light bulb is reduced, reducing the temperature, and the scan is repeated to show how the curves nest with a shift in the peak wavelength.
The temperature of the bulb’s filament can then be measured indirectly by determining the resistance of the bulb from the measured voltage and current. From the temperature, the theoretical peak wavelength can be calculated and compared to the measured peak wavelength.
Note: The results are qualitative, and suitable for introductory classes only.
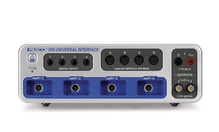
PASCO Advantage: The light bulb is powered by the interface, making it easy to change its temperature by changing the voltage across the bulb. All the complex calculations for the angle-to-wavelength conversion are stored in the setup file for PASCO Capstone.
Concepts
- Blackbody spectrum
- Peak wavelength vs. temperature
What's Included
- 1x Prism Spectrophotometer Kit - Blackbody Experiment (OS-8544)
- 1x Optics Bench, 60 cm (OS-8541)
- 1x Educational Spectrophotometer Accessory Kit (OS-8537)
- 1x Aperture Bracket (OS-8534A)
- 1x PASPORT Broad Spectrum Light Sensor (PS-2150)
- 1x PASPORT Rotary Motion Sensor (PS-2120A)
- 1x Voltage Sensor (unshrouded) (UI-5100)
- 1x Replacement Light Bulbs (10) (SE-8509)
- 1x Banana Plug Cord-Black (5 Pack) (SE-9751)
Data Collection Software
This product requires PASCO software for data collection and analysis. We recommend the following option(s). For more information on which is right for your classroom, see our Software Comparison: SPARKvue vs. Capstone »
Interface Required
This product requires a PASCO Interface to connect to your computer or device. We recommend the following option(s). For a breakdown of features, capabilities, and additional options, see our Interface Comparison Guide »
Buying Guide
| Replacement Parts | P/N | Price |
|---|---|---|
| Replacement Light Bulbs (10) | SE-8509 | -- |
Product Guides & Articles
Optics System Guide
Our expandable optics system provides everything you need to perform high-quality investigations in any physics lab. Introduce students to the fundamentals of optics with our comprehensive Basic Optics System; then build on the basics with a variety of optics accessories that support detailed studies of color, interference and diffraction, polarization, and more.
Experiments
| Blackbody Radiation Experiment | English | 9.56 MB |
Experiment Library
Perform the following experiments and more with the Blackbody Radiation Experiment.
Visit PASCO's Experiment Library to view more activities.
Blackbody Radiation
The spectrum of an incandescent light bulb is scanned by hand using a prism spectrophotometer that measures relative light intensity as a function of angle. A Broad Spectrum Light Sensor is used with a prism so the entire spectrum...
Support Documents
| Manuals | ||
|---|---|---|
| Aperture Bracket Manual | English - 809.69 KB | |
| Blackbody Light Source Manual | English - 687.70 KB | |
| Educational Spectrophotometer Instruction Manual | English - 3.19 MB | |
| Educational Spectrophotometer Manual | English - 3.19 MB | |
| OS-8543 Prism Mount Manual | English - 459.93 KB | |
| PASPORT Broad Spectrum Light Sensor Manual | English - 102.70 KB | |
| PASPORT Rotary Motion Sensor Manual | English - 588.17 KB | |
| Voltage Probe Manual | English - 319.81 KB | |
| Knowledge Base | ||
| Changing sensors associated with Capstone Workbooks | Oct 21st, 2022 | |


