What is Spectroscopy?
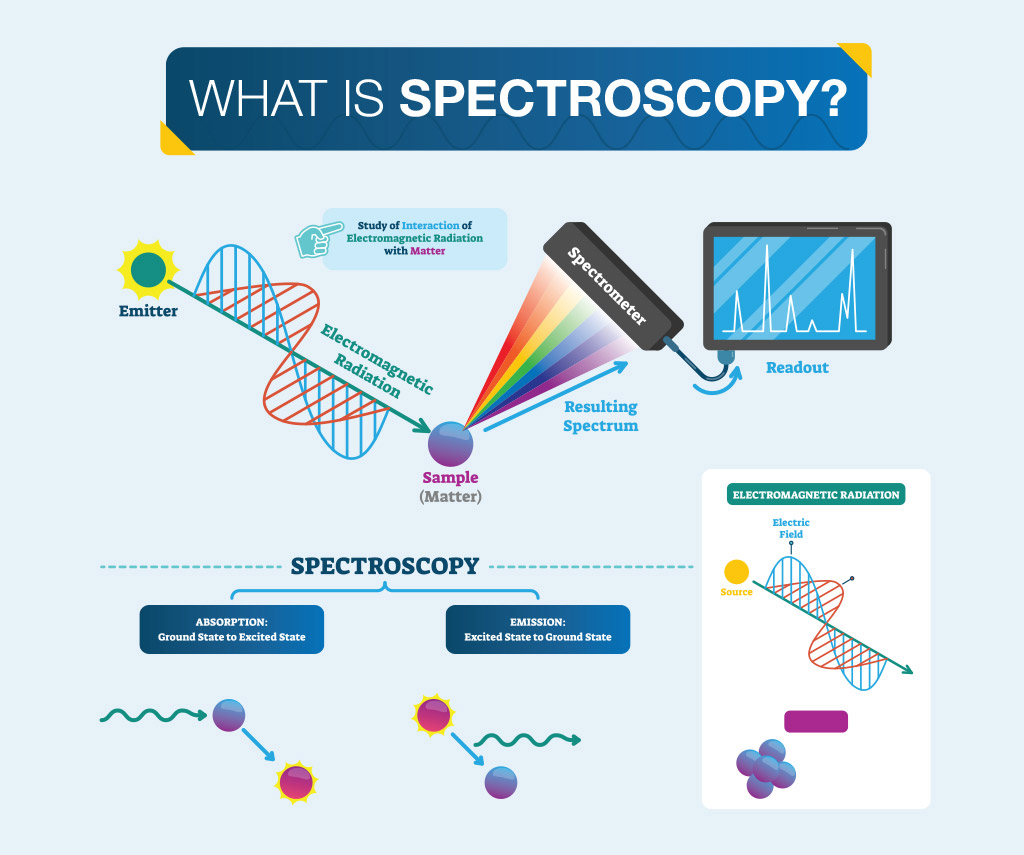
Spectroscopy is the investigation and measurement of spectra produced by matter interacting with or emitting electromagnetic radiation. Originally, spectroscopy was defined as the study of the interaction between radiation and matter as a function of wavelength. Now, spectroscopy is defined as any measurement of a quantity as a function of wavelength or frequency. During a spectroscopy experiment, electromagnetic radiation of a specified wavelength range passes from a source through a sample containing compounds of interest, resulting in absorption or emission. During absorption, the sample absorbs energy from the light source. During emission, the sample emits light of a different wavelength than the source’s wavelength.
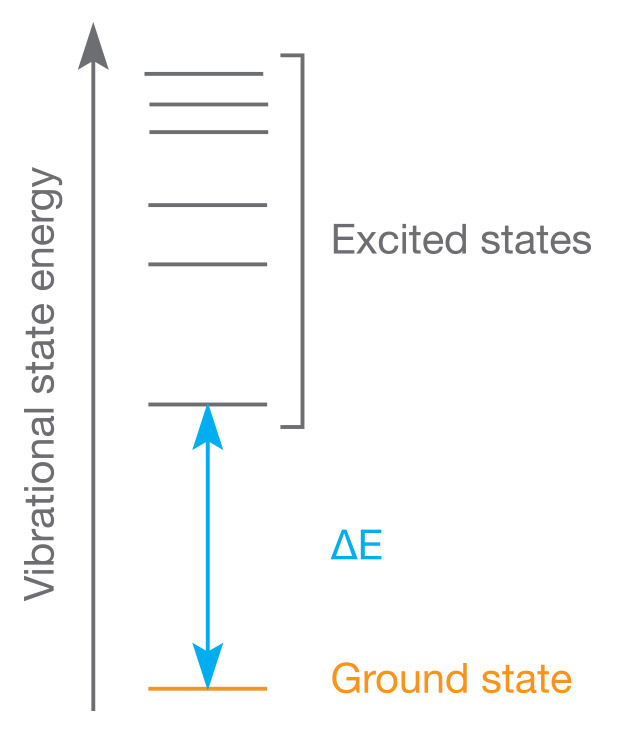
In absorption spectroscopy, the sample’s compounds are excited by the electromagnetic radiation provided by a light source. Their molecules absorb energy from the electromagnetic radiation, become excited, and jump from a low energy ground state to a higher energy state of excitation. A detector, usually a photodiode, on the opposite side of the sample records the sample’s absorption of wavelengths, and determines the extent of their absorption. The spectrum of a sample’s absorbed wavelengths is known as its absorption spectrum, and the quantity of light absorbed by a sample is its absorbance.
Each molecule within a sample will only absorb wavelengths with energies corresponding to the energy difference of the present transition. In simpler terms, this means that a molecule that jumps from ground state 1 to excited state 2, with an energy difference of ΔE, will allow other wavelengths to pass through until it can absorb radiation from a wavelength that corresponds to ΔE. Light that passes through to the photodiode without any absorption is called Stray Radiant Energy, or stray light. Absorption that occurs due to an energy difference between the two states is called an absorption line, and a collection of absorption lines creates an absorption spectra. The frequency of each absorption line in an absorption spectra tells us about the sample’s molecular structure, and can be influenced by factors such as stray light, environmental temperature, and electromagnetic fields.
What is Spectroscopy Used For?
Spectroscopy is used in physical and analytical chemistry to detect, determine, or quantify the molecular and/or structural composition of a sample. Each type of molecule and atom will reflect, absorb, or emit electromagnetic radiation in its own characteristic way. Spectroscopy uses these characteristics to deduce and analyze the composition of a sample.
Examples of Spectroscopy Applications
- Determining the atomic structure of a sample
- Determining the metabolic structure of a muscle
- Monitoring dissolved oxygen content in freshwater and marine ecosystems
- Studying spectral emission lines of distant galaxies
- Altering the structure of drugs to improve effectiveness
- Characterization of proteins
- Space exploration
- Respiratory gas analysis in hospitals
Spectrometer Components
Light Sources
In spectroscopy, light sources are dependent on the range of the electromagnetic spectrum being analyzed. For UV-VIS and NIR range spectroscopic applications, xenon is a popular light source choice, but most spectrometers use a halogen lamp. Xenon offers smooth emission for UV-VIS spectrums ranging from 750-1000 nm, but halogen lamps are more affordable. When a continuous UV spectrum is required, a deuterium arc lamp is the optimal light source. Deuterium offers a long life span and high intensity at the far end of its UV range, making it the golden standard of UV light sources.
Non-dispersive Elements
Non-dispersive materials can be used to filter out non-target ranges of wavelengths from the light source. These filters reduce stray light and can improve the resolution of most spectrometers.
Dispersive elements - Prisms
In the 1660’s, Newton split light into a spectrum using a glass prism. Today, school children around the world use prisms as dispersive devices to transform white light into a spectrum of component colors. As the white light enters the prism, different wavelengths experience different frequencies and a change in velocity due to the altered medium. This refraction causes the light to exit the prism as a spectrum, because each wavelength experiences a different angle of refraction. This is why light from a prism takes the classic rainbow shape, where red is above orange, orange is above yellow, and so on.
Dispersive elements - Diffraction Gratings
Diffraction gratings offer improved efficiency over prisms, which sometimes absorb light that passes through them. Sometimes only a very small percentage of spectrum light is measured, so using a prism can reduce experimental accuracy. A diffraction grating has thousands of narrow lines ruled onto a glass surface, similarly to a CD. While prisms refract light, diffraction gratings reflect light, so no photons are missed during analysis. Gratings can also be used for UV wavebands, while prisms are opaque to UV.
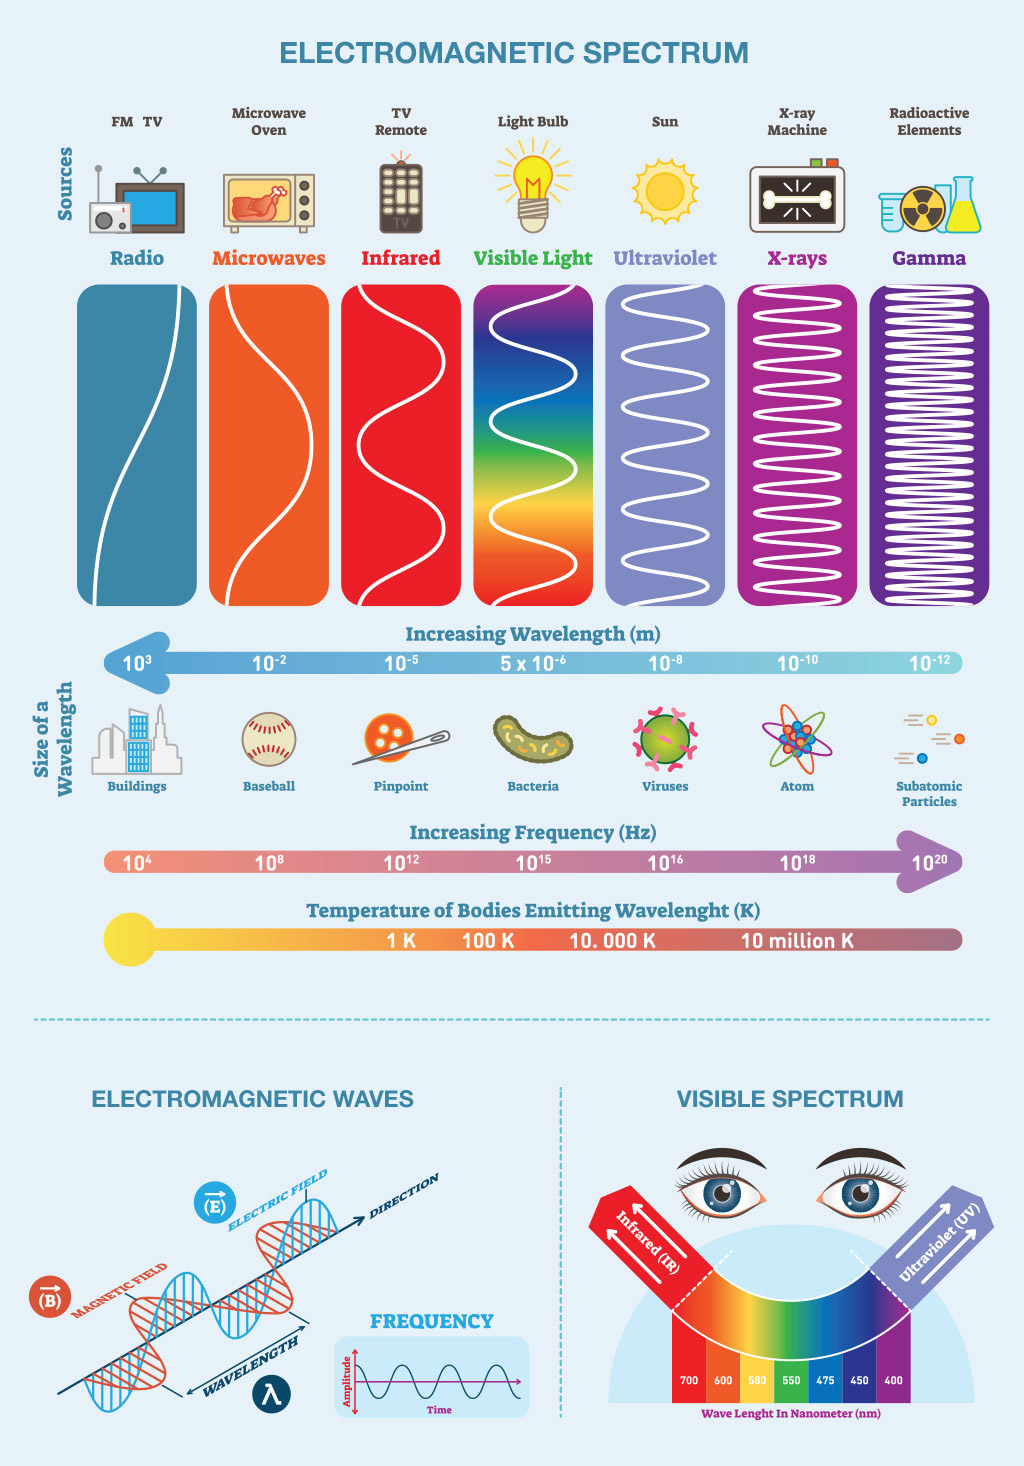
The wavelength range, also known as the spectral range, is the range of wavelengths that a spectrometer can accurately sense. The spectral range of a spectrometer is partially determined by the diffraction grating’s groove density and the size of the detector. A well-made diffraction grating will reduce the amount of stray light sensed by the photodiode. A higher groove density typically produces a smaller wavelength range and increasing a spectograph’s optical path can produce high resolution configurations.
Fiber Optic Cables and Spectrometry
In absorbance spectrometry, a sample is placed in a cuvette, which is inserted into the spectrometer. NIR and IR spectrometry often analyze sources that cannot be placed in a cuvette, so a fiber optic cable is used instead. Fiber optic cables, made of glass or plastic, transport light from an external source to the photodiode of a spectrometer using total internal reflection. Glass fiber optic cables are attenuated by absorption and scattering factors. Water bands due to minute amounts of water vapor in the glass cause absorption, and scattering occurs when light bounces off molecules within the glass. To reduce light absorption, the refractive index of the fiber optic core must be greater than the refractive index of the cladding. Fiber optic cables are most often applied to NIR and IR studies, which frequently have sources that cannot be transferred to a cuvette. The most common fiber optic wavelengths are 850 nm, 1300 nm, and 1550 nm.
Spectral Resolution
The spectral resolution of a spectrometer refers to its ability to resolve spectral features and bands into their respective components. In dispersive array spectrometers, spectral resolution is dependent on the slit, diffraction grating, and detector. The slit determines the minimum image size that the optical bench can form on the photodiode. The diffraction grating determines the total wavelength range of the spectrometer, and the detector determines the maximum number and size of discrete points that can be digitized. If the spectral resolution is too low for an experiment, then the data will be missing key points. A high resolution spectrometer can extend the total measurement time, but the quality of the data is optimized.
Types of Spectrometers and Spectroscopy
While there are many types of spectrometers, all spectrometers take in light, split it into its spectral components, digitize the signal as a function of wavelength, and display it through a computer. The design of a spectrometer changes depending on the scope and intentions of the experiment, allowing researchers to measure molecular vibrations, absorbance, mass-to-charge ratios, and much more.
Monochromator
A monochromator is structurally similar to a spectrometer, but provides a much smaller window of data. A monochromator captures one measurement in the UV-VIS spectrum at a particular, predetermined, wavelength or bandwidth. Alternatively, a spectrometer captures the entire UV-VIS spectrum in the same amount of time, and provides values for each wavelength.
Radiometer
Radiometers, or light meters, are used to measure light in the UVA/VIS, UVA, and VIS spectra. Radiometers consist of a meter body that measures current voltage from an internal or external detector. A sensor or photodiode is used to measure a specific band of light, and filters are added to the sensor to block unwanted wavelengths. Radiometer sensors are calibrated at the desired peak intensity and measure all of the light under the curve to generate a single reading.
Spectrograph
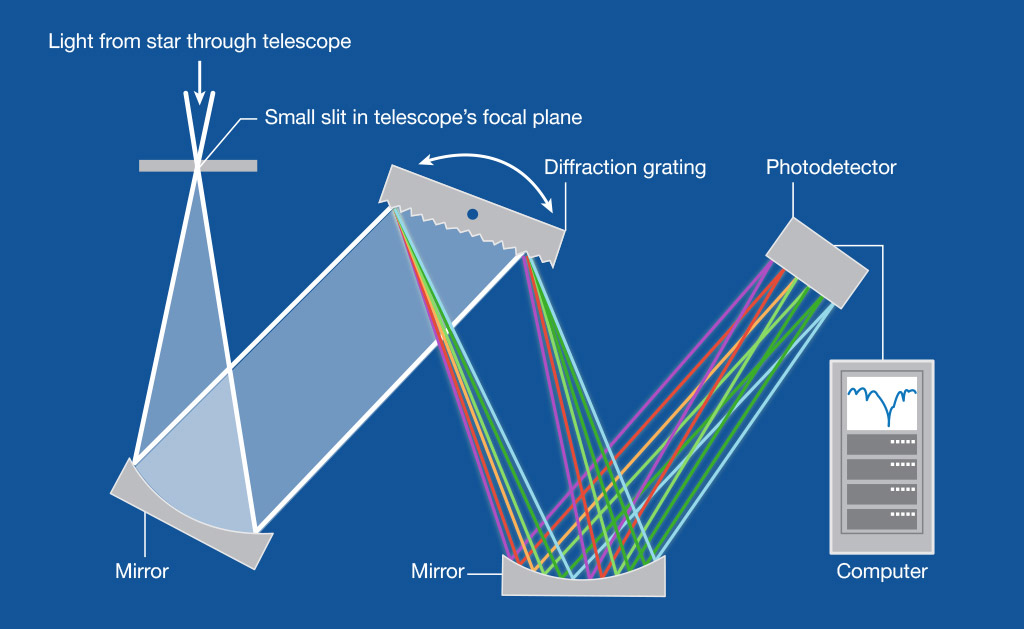
A spectrograph is an instrument that separates light by its wavelength or frequency and records the resulting spectral range in a multichannel detector, such as a photographic plate. Light entering a spectrograph through a small opening in the spectrograph hits a collimating mirror that lines up the entering rays of light parallel to each other. Then, the rays hit a diffraction grating, passing through or bouncing off into their constituent wavelengths, each with their own speed and direction that are dependent on their spectral color. The grating bends each wavelength in a different direction, separating red from orange, orange from yellow, and so on. The diffraction grating controls can be rotated to change which wavelengths of light reach a second mirror, which then focuses them onto a photodetector that converts photons into electrical signals for computer analysis.
Spectroradiometer
Spectroradiometers are ideal for measuring the spectral energy distribution of small, precise light sources. Light is dispersed using prisms or diffraction gratings. Spectroradiometers record the radiation spectrum of a light source and calculate parameters such as luminance and chromaticity. Factors such as sensitivity, linearity, stray light, and polarisation error are less influential on spectroradiometry than spectrometry, making spectroradiometry a more efficient method for measuring narrow-band emitters.
Spectroscope
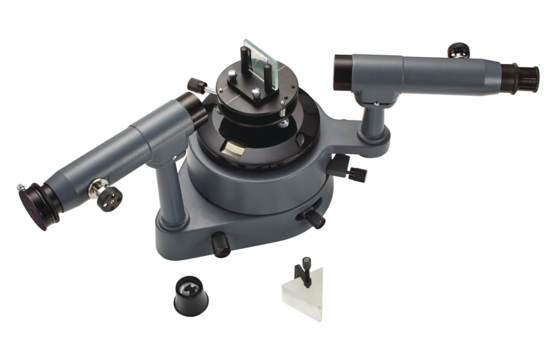
A spectroscope is a hand-held device used to identify the spectral composition of light. Light passes through a slit at one end, enters a prism, and is observed as a spectrum by the user’s eye. Early astronomers used spectroscopes to study the composition of planets and stars. The spectrums observed by these astronomers played a key role in dozens of hypotheses about the gaseous nature of planets within our solar system.
Spectrophotometers
Spectrophotometry measures how much light is absorbed by, reflected off, or transmitted through a chemical substance by measuring the intensity of light as the beam passes through a sample. Electromagnetic energy from the sample, enters the device through the aperture and is separated into its component wavelengths by holographic grating. The separated light rays are focused onto a CCD array detector which determines the intensity of each wavelength using a pixel of the array. Spectrophotometry has broad applications within science and is used within biochemistry, physics, material and chemical engineering, clinical application, and chemistry. Spectrophotometers can be divided into two categories that are dependent on the wavelength of the light source.
UV-Visible spectrophotometers use wavelengths of light that are higher than the ultraviolet range (185 - 400 nm) and visible range (400 - 700 nm) of the electromagnetic spectrum. This type of absorption spectroscopy targets the transition of molecules from the ground state to the excited state. UV-VIS spectroscopy is commonly used by analytical chemists for the quantitative determination of different analytes, such as organic compounds, macromolecules, and metal ions.
IR spectrophotometers use light wavelengths in the infrared range (700 - 15000 nm) of the electromagnetic spectrum. IR spectrometry is usually practiced by organic chemists and measures the vibrations of atoms to facilitate the determination of a sample’s functional groups.
Mass Spectroscopy
Mass spectrometry is frequently used by biologists and chemists to measure the mass-to-charge ratio (m/z) of one or more molecules present within a sample. The mass-to-charge ratio can be used to calculate the molecular weights of the solution’s components, which are then used to determine and quantify the solutions’s molecular composition. Mass spectrometry can be used to identify molecules within a sample, detect impurities, analyze a purified protein, or study the protein content of cells.
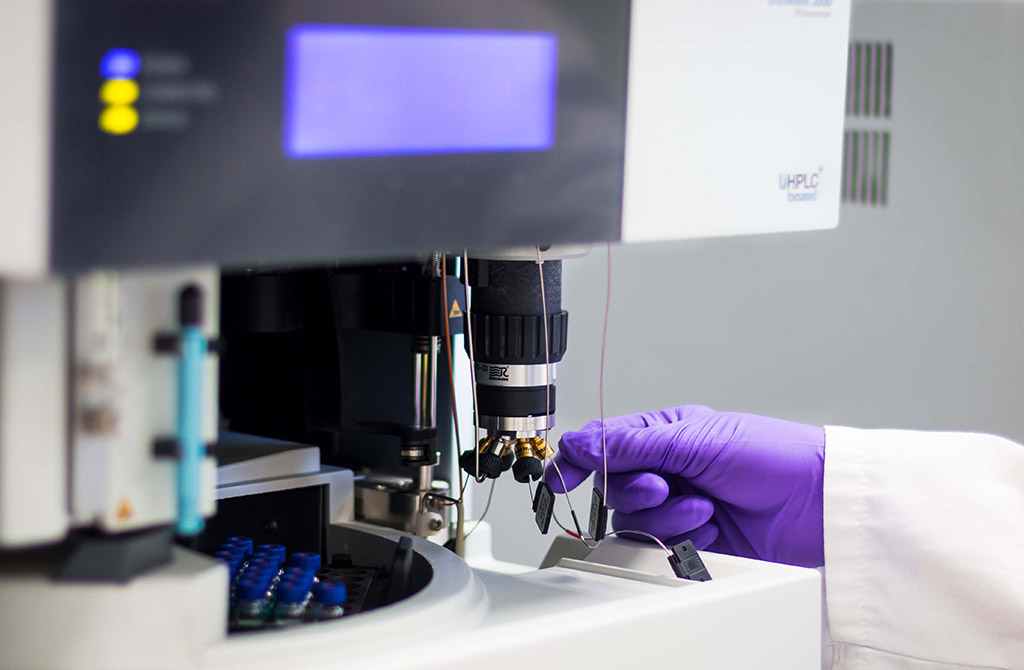
Mass spectrometers use these three components for their measurements: ionization source, mass analyzer, and ion detection system. The ionization source converts molecules to gas-phase ions via vaporization before manipulating them with external electric and magnetic fields. The mass analyzer sorts and separates ions according to their mass-to-charge ratios using acceleration and deflection. The ion detection system measures ions separated by the mass analyzer and sends the data to a system where the m/z ratios are stored. In the final stage of mass spectrometry, the mass-to-charge ratios of a sample’s ions are plotted against their intensities. The produced peaks indicate the relative abundance of the sample’s molecular components.
NIR and FT-NIR Spectroscopy
Near-infrared spectroscopy uses a halogen light source to produce near-infrared wavelengths (12,000 - 4,000 1/cm) that are composed of overtone and combination bands. Each band correlates to vibration frequencies that are related to a change in dipole moment between the bonds of the atoms within the sample. NIR spectroscopy usually requires a high resolution spectrometer to ensure accurate data. Most NIR spectrometers use software algorithms and statistical methods to interpret each frequency, which are expressed in the form of a graph. Each peak represents the identification of a material, and the size of the peak corresponds to the amount of material present.
Fourier transform near-infrared (FT-NIR) spectroscopy uses a prism or moving grating to separate the individual frequencies emitted from the near-infrared source. A detector measures the amount of energy that passes through the sample at each frequency. Fourier transform near-infrared spectrometers use an interferogram signal to encode all of a sample’s infrared frequencies, which allows the signal to be collected with multiple scans each second. The interferogram can be decoded into a spectrum of frequency versus intensity using the Fourier transformation. Today, most NIR spectrometers purchased are FT-NIR spectrometers due to their high accuracy and time efficiency.
Optical Spectroscopy
Optical spectroscopy is the study of how matter interacts with electromagnetic radiation. It is frequently used in the pharmaceutical industry and can determine a sample’s metal content, the concentration of an active ingredient, the sample’s color, or identity. Optical spectroscopy utilizes a wide spectral range of 0.2 nanometers to 500 microns.
Raman Spectrometry
Raman spectroscopy is complementary to infrared spectroscopy. While both technologies measure changes in molecular vibrations and rotations, infrared spectroscopy measures the amount of IR light absorbed and raman measures the amount of light scattered. Raman Spectroscopy is a chemical analysis technique that provides detailed information about a sample’s phase and polymorphy, crystallinity and molecular interactions, and chemical structure. In chemistry, raman spectroscopy is used to determine the vibrational modes of molecules. It is based upon the Raman light scattering technique, whereby a molecule scatters incident light from a high intensity laser light source. Most of the scattered light will be the same wavelength as the light source, and therefore irrelevant. This is known as a Rayleigh scatter. A very small percentage of light is scattered at different wavelengths than the source, producing a Raman scatter with wavelengths that are dependent on the chemical structure of the analyte.
The reflectant light’s wavelength is specific to various chemical components and enables the detection of the atheromatous plaque chemical synthesis. Raman spectrometers can discriminate between various plaque components including elastic, cholesterol, collagen, lipids, and calcium apatite deposits.
Raman spectroscopy delivers excitation light and collects emitted light through flexible optical fibers. Fluorescence spectra is collected and used to differentiate normal tissue from abnormal tissue.
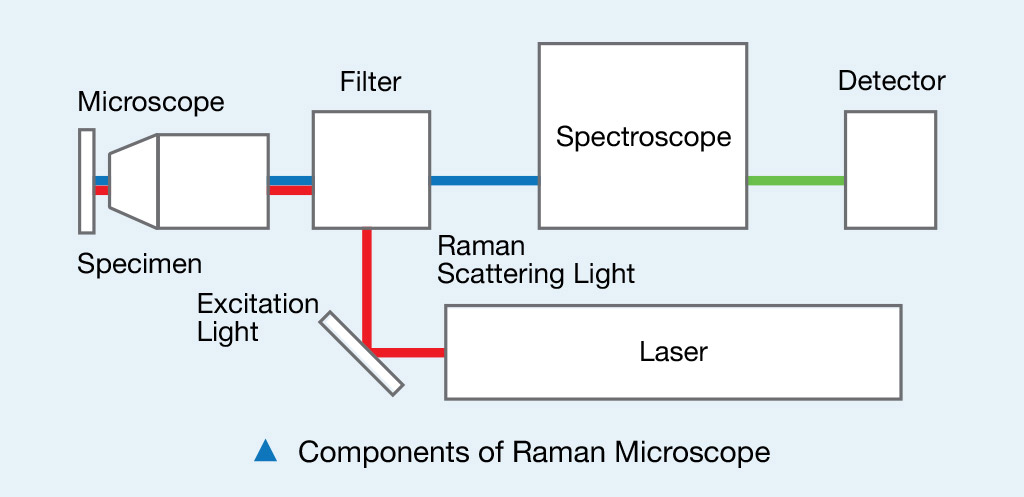
Raman spectrometers are among the most popular in clinical diagnostics, and are similar to NIR spectrometers. However, Raman spectroscopy is based on an inelastic scattering process, and infrared spectroscopy is based on an absorption process. Raman spectrometers measure vibrations involving a change in polarizability, while infrared spectrometers detect vibrations involving a change in dipole moment. Raman spectroscopy can often be used with aqueous solutions, but infrared spectrometers do not offer the same freedom due to high water absorbance.
Teaching Tools
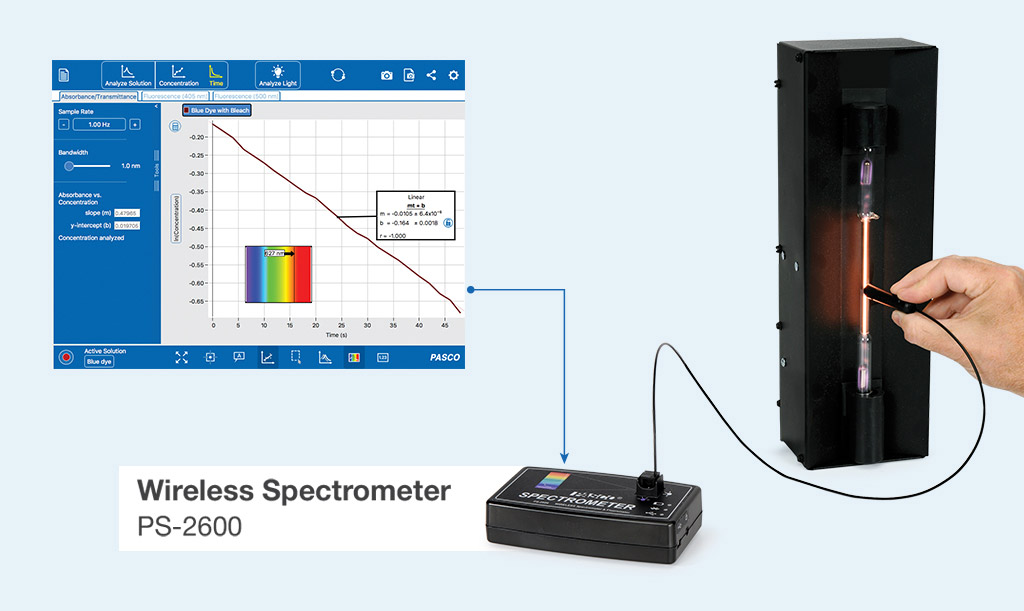
Wireless Spectrometer (VIS)
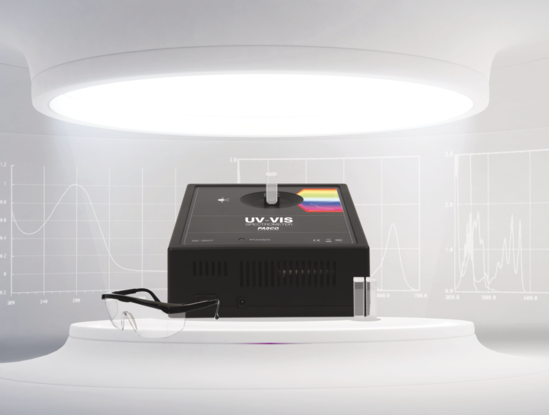
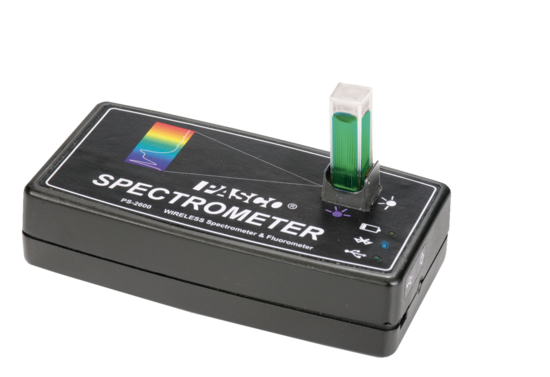
The Wireless Spectrometer makes spectrometry investigations accessible to educators and students, with easy-to-use software and spectral analysis tools that mirror those used by academic researchers. Designed for fast-paced science courses, the Wireless Spectrometer reduces the time it takes to test samples, collecting a full spectrum of data in less than two seconds. The included spectrometry software allows students to quickly and easily analyze the absorbance of solutions, or the emission of spectra, with automated standard curves and high-quality, interactive displays. Students can explore concentrations, kinetics experiments, and even emission spectra with the optional fiber optic cable.

