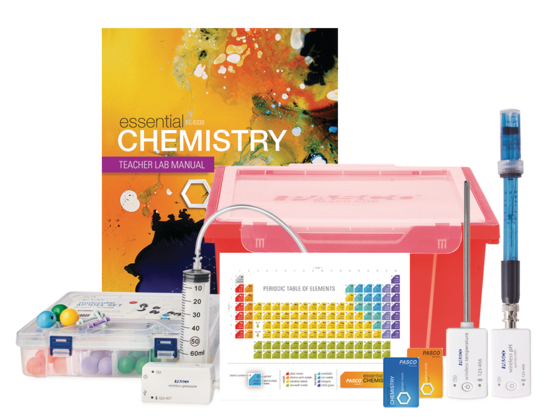
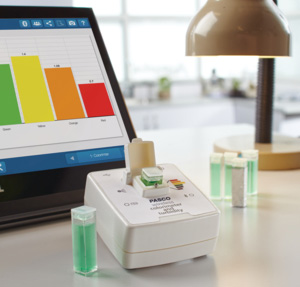
The laboratory portion of the College Board AP® Chemistry course plays an integral role in preparing students for the AP Chemistry exam. For students, these hands-on exercises provide a bridge between abstract theories and their practical applications, while also supporting the development of scientific literacy, problem-solving, and analytical thinking skills.
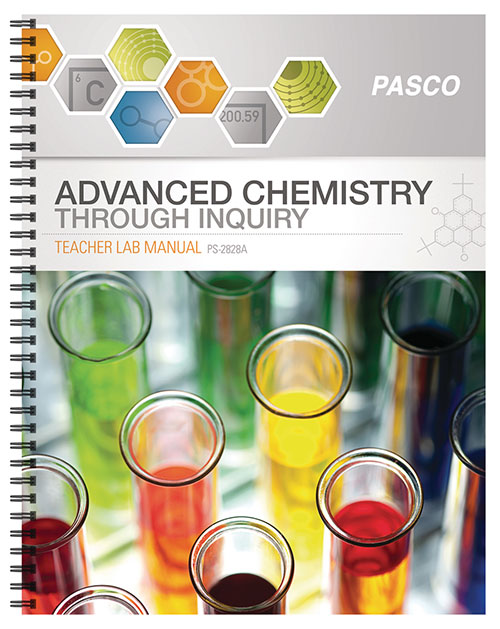
Advanced Chemistry Through Inquiry Teacher Lab Manual
Bring AP Chemistry to life with sixteen engaging experiments, each designed around the latest Learning Objectives and Science Practices.
Authored by chemistry educators, the Advanced Chemistry Through Inquiry Teacher Lab Manual includes sixteen guided inquiry labs that cover AP Chemistry course concepts such as Moles and Molar Mass, Stoichiometry, and Reaction Rates.
AP Chemistry Course Alignment
Each investigation addresses at least one Learning Objective and Science Practice for Advanced Placement® Chemistry, as outlined in the College Board AP® Chemistry Course and Exam Description.
This page provides AP Chemistry alignment details for the labs inside PASCO’s Advanced Chemistry Through Inquiry Teacher Lab Manual. A complete list of applicable AP Chemistry Big Ideas, Learning Objectives, and Science Practices is provided for each lab. High school alignment details, including NGSS-alignment details are provided in the teacher version of each lab.
Need a quick guide?
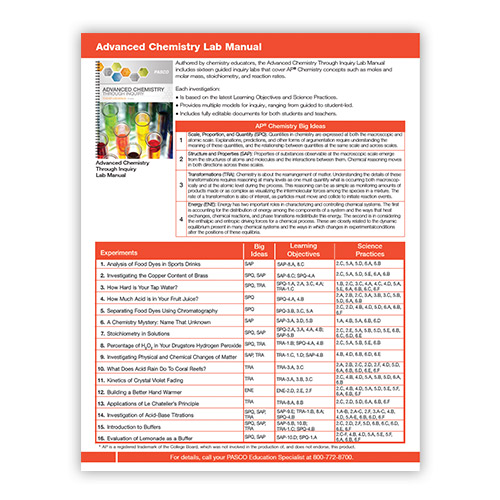
Download the AP Chemistry Alignment Sheet.
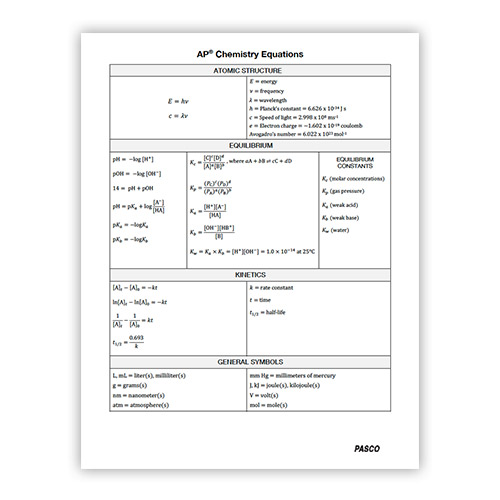
Download the Equation Sheet for AP Chemistry.
Advanced Chemistry Through Inquiry Teacher Lab Manual Lab Titles
| 1 - Analysis of Food Dyes in Sports Drinks | 9 - Investigating Physical and Chemical Changes of Matter |
| 2 - Investigating the Copper Content of Brass | 10 - What Does Acid Rain Do to Coral Reefs? |
| 3 - How Hard is Your Tap Water? | 11 - Kinetics of Crystal Violet Fading |
| 4 - How Much Acid is in Your Fruit Juice? | 12 - Building a Better Hand Warmer |
| 5 - Separating Food Dyes Using Chromatography | 13 - Applications of Le Châtelier’s Principle |
| 6 - A Chemistry Mystery: Name That Unknown! | 14 - Investigation of Acid-Base Titrations |
| 7 - Stoichiometry in Solutions | 15 - Introduction to Buffers |
| 8 - Percentages of H2O2 in Drugstore Hydrogen Peroxide | 16 - Evaluating Lemonade as a Buffer |
| Multi-Step Model for Student Inquiry | |
|
Each experiment provides a multi-step model for student inquiry that can easily be segmented to fit your course scope and sequence. The components of this model include:
|
|
Analysis of Food Dyes in Sports Drinks
Designed as an introduction to spectroscopy, this lab uses the food dyes found in sports drinks to engage students in an investigation of the relationship between color, absorbance, and concentration.
In the initial investigation, students use a Wireless Colorimeter & Turbidity Sensor to measure the absorbance and transmittance of FD&C Blue #1 dye. Students learn how to select an optimum wavelength for analysis, create a series of dilutions, and produce a calibration curve to determine the concentration of a solution.
In the advanced investigation, students sharpen their graphical analysis skills by comparing graphs of food dye concentration (M) vs. %Transmittance, Transmittance, logT, and -logT. Students use the analysis tools in SPARKvue to compare linear fits for each graph and answer the analysis questions.
| Boilerplate | Students use a colorimeter to quantify the amount of food dye in a sports drink. |
| Prerequisite Concepts | Electromagnetic spectrum, spectroscopy or colorimetry (instrument dependent), transmission and absorbance, wavelength, solution concentration, molarity, Beer’s law |
| Big Ideas | Structure and Properties (SAP) |
| Primary Learning Objective |
SAP-8.A: Explain the relationship between a region of the electromagnetic spectrum and the types of molecular or electronic transitions associated with that region. |
| Secondary Learning Objective |
SAP-8.C: Explain the amount of light absorbed by a solution of molecules or ions in relation to the concentration, path length and molar absorptivity. |
| Science Practices | 2.C, 5.A, 5.D, 6.A, 6.B |
Teaching Tools
Looking for AP Chemistry equipment?
Perform all sixteen of these labs—plus more—with our phenomena-based Chemistry Lab Stations.Investigating the Copper Content of Brass
In this lab, students extend their knowledge of spectrometry, colorimetry, and the electromagnetic spectrum by determining the concentration of copper in a sample of brass.
In the initial investigation, students are given two samples of transition metal solutions. They use a Wireless Colorimeter or Wireless Spectrometer to measure the absorbance of each sample; then reference their data to determine the wavelength at which the absorbance is highest.
Next, students create a calibration curve by preparing a series of dilutions from stock 0.2M Copper (II) nitrate. They calculate the concentration of each sample and make measurements of absorbance and transmittance at the optimum wavelength.
In the advanced investigation, students apply what they’ve learned to determine the amount of copper in a sample of brass. Students calculate the amount of HNO3 needed to completely react with a sample of brass, collect absorbance readings at the optimum wavelength, and use their data to answer the post-lab questions.
| Boilerplate | Students use a spectrometer or colorimeter to quantify the copper content of a sample of brass. |
| Prerequisite Concepts | Spectrophotometry or colorimetry (instrument-dependent), Beer’s law, calibration curve, solution concentration, electron transitions |
| Big Ideas |
Structure and Properties (SAP) Scale, Proportion and Quantity (SPQ) |
| Primary Learning Objective |
SAP-8.C: Explain the amount of light absorbed by a solution of molecules or ions in relation to the concentration, path length and molar absorptivity. |
| Secondary Learning Objective |
SPQ-4.A: Explain changes in the amounts of reactants and products based on the balanced reaction equation for a chemical process. |
| Science Practices | 5.D, 6.B, 6.A, 2.C, 5.A, 5.E |
How Hard is Your Tap Water?
How Hard is Your Tap Water? introduces students to conductometric titrations and gravimetric analysis with a hands-on investigation of tap water hardness.
In the initial investigation, students perform a precipitation reaction using calcium chloride and sodium carbonate. They learn how to measure materials before and after a reaction to determine the mass of a product, and calculate the percent yield and percent error of their product recovery.
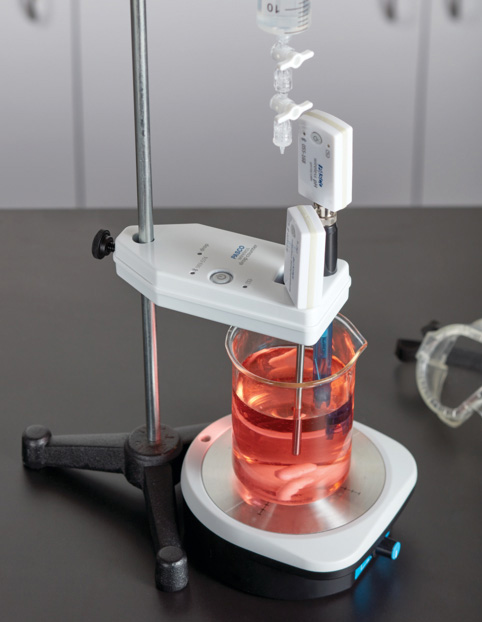
In the next section, students perform a conductometric titration of calcium chloride with sodium carbonate. They use a conductivity sensor and the Wireless Drop Counter to generate a live titration curve of fluid volume (mL) vs. conductivity (µS/cm). Students analyze their titration curves to identify the equivalence point and calculate the molarity of the calcium chloride solution.
The advanced investigation helps solidify what students have learned by challenging them to determine the concentration of calcium ions in two different water samples. This time students take the lead. They perform two conductometric titrations, analyze their titration curves, and perform calculations to answer the analysis questions.
| Boilerplate | Students use a conductometric titration and gravimetric analysis to determine how much CaCO3 is in a water sample. |
| Prerequisite Concepts | Gravimetric analysis, double replacement reactions, precipitate, water hardness, stoichiometry, conductivity |
| Big Ideas |
Scale, Proportion and Quantity (SPQ) Transformations (TRA) |
| Primary Learning Objectives |
SPQ-1.A: Calculate quantities of a substance or its relative number of particles using dimensional analysis and the mole concept. SPQ-2.A: Explain the quantitative relationship between the elemental composition by mass and the empirical formula of a pure substance. |
| Secondary Learning Objectives |
TRA-1.C: Represent a given chemical reaction or a physical process with a consistent particulate model. SPQ-3.C: Explain the relationship between the design and result of a separation experiment, and in the interactions of the solute, solvent and surfaces involved in the experiment. SPQ-4.A: Explain changes in the amounts of reactants and products based on the balance reaction equation for a chemical process. |
| Science Practices | 3.C, 1.B, 4.A, 4.C, 6.C, 5.A, 5.E, 6.B, 6.A, 2.C, 6.F, 4.D |
Teaching Tools
Wireless Drop Counter
Take the guesswork out of student titrations by tracking volume with the Wireless Drop Counter.
Add the Wireless pH Sensor to generate titration curves in real time.
How Much Acid is in Your Fruit Juice?
In this guided-inquiry, students perform an acid-base titration to determine the concentration of acid in commercially sold fruit juice.
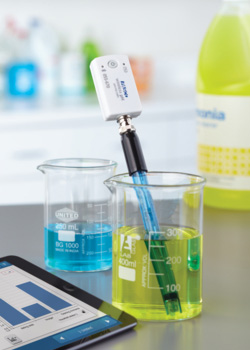
In the initial investigation, students titrate acetic acid with sodium hydroxide. They use a Wireless pH Sensor to track the pH of the analyte during the titration and record the volume of titrant added by hand. Students are encouraged to repeat the titration twice more to improve their technique.
In the advanced investigation, students apply what they’ve learned about acid-base titrations to determine the amount of acid in a sample of fruit juice. They use a Wireless pH Sensor to track their titration progress, create a titration curve, and answer post-lab analysis questions.
| Boilerplate | Students use titration and a pH sensor to study the organic acid content of fruit juices. |
| Prerequisite Concepts | Acids and bases, pH, titration, equivalence point, neutralization reaction, endpoint |
| Big Ideas | Scale, Proportion and Quantity (SPQ) |
| Primary Learning Objective |
SPQ-4.B: Identify the equivalence point in a titration based on the amounts of the titrant and analyte, assuming the reaction goes to completion. |
| Secondary Learning Objective |
SPQ-4.A: Explain changes in the amounts of reactants and products based on the balance reaction equation for a chemical process. |
| Science Practices | 2.A, 2.B, 2.C, 3.A, 3.B, 3.C, 5.B, 5.D, 6.A, 6.B |
Teaching Tools
Wireless pH Sensor
Get instant pH readings on virtually any device with the Wireless pH Sensor.
Pair it with the Wireless Drop Counter to generate live titration curves as the lab unfolds.
Separating Food Dyes Using Chromatography
In this lab, students use colorimetry and chromatography to deduce the properties of food dyes, while learning about polarity and intermolecular forces.
In the pre-lab, students research the chemical structure of two food dyes found in a packet of Grape Kool Aid™. They predict which dye has the highest polarity and the wavelengths at which the absorbance will be highest for each.
In the initial investigation, students test their hypotheses by performing a colorimetric analysis. They retrieve a sample of Kool Aid™ and two standards of dyes used in the flavoring. They use a Wireless Colorimeter to identify the optimum wavelength for analysis and collect data for each sample.
In the advanced investigation, students learn how to separate a mixture using paper chromatography. They run three chromatograms: one for the Kool Aid™ sample and one for each dye standard. In part two, students practice separating the same three mixtures using column chromatography.
| Boilerplate | Students use paper and column chromatography to separate the colored food dyes in Grape Kool-Aid™. |
| Prerequisite Concepts | Paper chromatography, column chromatography, colorimetry, polarity, rate of flow (Rf), separation of mixtures, intermolecular forces, formal charge |
| Big Ideas | Scale, Proportion and Quantity (SPQ) |
| Primary Learning Objectives |
SPQ-3.B: Represent the relationship between the potential energy and distance between atoms, based on factors that influence the interaction strength. SPQ-3.C: Explain the relationship between the solubility of ionic and molecular compounds in aqueous and non-aqueous solvents, and the intermolecular interactions between particles. |
| Secondary Learning Objective |
SPQ-5.A: Explain the relationship between the chemical structures of molecules and the relative strength of their intermolecular interactions when: |
| Science Practices | 2.C, 2.D, 4.B, 4.D, 5.D, 6.A, 6.B, 6.F |
A Chemistry Mystery: Name That Unknown!
In this guided-inquiry investigation, students become chemistry researchers as they perform tests to uncover the properties of an unknown substance.
In the initial investigation, students test three known substances and practice inferring their chemical properties. For each substance, students record the color, water solubility, solution conductivity, pH, and melting point, as well as whether it reacts with acids or bases. The results of the tests are analyzed and the substances are classified as ionic, polar covalent, or nonpolar covalent.
In the advanced investigation, students perform the same tests to determine the properties of five unknown substances. They identify the type of bonding (ionic, polar covalent, nonpolar covalent) present in each sample and use data to justify their reasoning.
| Boilerplate | Students use several methods to characterize compounds according to the nature of intramolecular bonding. |
| Prerequisite Concepts | Chemical bonding, ionic bond, polar covalent bond, nonpolar covalent bond, physical and chemical properties, solubility, intramolecular forces, atomic structure |
| Big Ideas | Structure and Properties (SAP) |
| Primary Learning Objectives |
SAP-3.A: Explain the relationship between the type of bonding and the properties of the elements participating in the bond. SAP-5.B: Explain the relationship between the macroscopic properties of a substance, the particulate level structure of the substance, and the interaction between these particles. |
| Secondary Learning Objective |
SAP-3.C: Represent an ionic solid with a particulate model that is consistent with Coulomb's law and the properties of the constituent ions. |
| Science Practices | 1.A, 4.B, 5.A, 6.B, 6.D |
Stoichiometry in Solutions
In Stoichiometry in Solutions, students use conductometric titration and particle modeling to develop a deeper understanding of stoichiometry.
In the initial investigation, students perform a conductometric, acid-base titration. They monitor the titration curve in real time using a Wireless Temperature Sensor, Wireless Conductivity Sensor, and Wireless Drop Counter. Students reference their data to perform calculations and determine the equivalence point and endpoint of the reaction.
In the advanced investigation, students repeat the same titration using a different concentration of HCl. They draw a prediction of the titration curve and indicate where they expect the endpoint to occur. Students perform the titration, note when the indicator changes color, and plot a copy of their titration curve. They then reference their data to answer free response questions and propose an experimental design.
| Boilerplate | Students use conductometric titration and particle modeling to study the stoichiometry of an acid-base titration. |
| Prerequisite Concepts | Stoichiometry, titration, acid-base reactions, thermochemistry, net ionic equation, limiting reactant, thermodynamics, endothermic and exothermic reactions |
| Big Ideas |
Scale, Proportion and Quantity (SPQ) Structure and Properties (SAP) |
| Primary Learning Objectives |
SPQ-3.A: Calculate the number of solute particles, volume or molarity of solutions. SPQ-4.A: Explain changes in the amounts of reactants and products based on the balanced reaction equation for a chemical process. SPQ-4.B: Identify the equivalence point in a titration based on the amounts of the titrant and analyte, assuming the reaction goes to completion. |
| Secondary Learning Objectives |
SPQ-2.A: Explain the quantitative relationship between the elemental composition by mass and the empirical formula of a pure substance. SAP-5.B: Explain the relationship between the macroscopic properties of a substance, the particulate level structure of the substance, and the interaction between these particles. |
| Science Practices | 2.C, 2.E, 2.F, 5.B, 5.A, 5.D, 5.E, 6.D, 6.B, 6.C, 6.E |
Teaching Tools
Wireless Conductivity Sensor
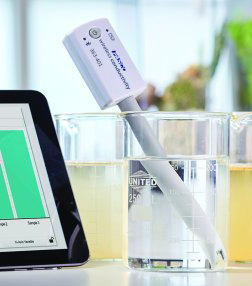
Easily measure both solution conductivity and total dissolved solids with the Wireless Conductivity Sensor.
Percentage of H2O2 in Drugstore Hydrogen Peroxide
In this lab, students perform a redox titration to determine the content of hydrogen peroxide in a drugstore formulation.
In the initial investigation, students perform a titration to standardize potassium permanganate with ferrous ammonium sulfate (FAS). They use an Oxidation Reduction Potential Probe (ORP) and Wireless Drop Counter to generate a real-time plot of fluid volume vs. voltage (mV).
In the advanced investigation, students perform a similar titration to determine the concentration of hydrogen peroxide in a drugstore formulation. They plot a copy of their final titration curve, analyze their results, and answer free response questions.
| Boilerplate | Students use titration with a redox probe to determine the hydrogen peroxide content of a drugstore formulation. |
| Prerequisite Concepts | Reduction-oxidation reactions (redox reactions), titration, molarity, percent composition, oxidizers, reducing agents, thermochemistry |
| Big Ideas |
Scale, Proportion and Quantity (SPQ) Transformations (TRA) |
| Primary Learning Objective |
TRA-1.B: Represent changes in matter with a balanced reaction or net ionic equation: |
| Secondary Learning Objectives |
SPQ-4.A: Explain changes in the amounts of reactants and products based on the balance reaction equation for a chemical process. SPQ-4.B: Identify the equivalence point in a titration based on the amount of the titrant and analyte, assuming the titration reaction goes to completion. |
| Science Practices | 2.C, 5.A, 5.B, 5.E, 6.B |
Teaching Tools
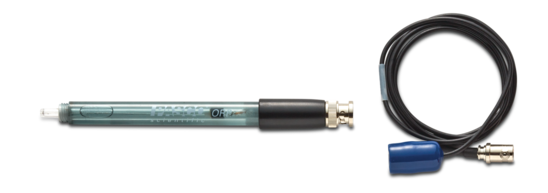
Oxidation Reduction Potential Probe
Help students determine whether a chemical species will act as an oxidizing or reducing agent with the Oxidation Reduction Potential Probe.
Investigating Physical and Chemical Changes of Matter
This lab introduces students to a variety of methods for determining whether an observed change in matter is due to physical or chemical changes at the intramolecular level.
In the initial investigation, students observe two reactions between unknown species and infer which reaction caused a chemical change. They work with group members to brainstorm how different sensors (temperature, pH, etc.) could be used to confirm their hypothesis.
In the advanced investigation, students repeat the unknown reactions while collecting data. They record the color, pH, temperature, and conductivity of both the reactants and the reaction. Then they use their results to represent each reaction at the particulate-level and answer free response questions.
| Boilerplate | Students use a variety of sensors and particle modeling to characterize physical and chemical changes of matter. |
| Prerequisite Concepts | Physical and chemical properties, physical and chemical changes, intermolecular interactions, intramolecular interactions, particle modeling, phase changes |
| Big Ideas |
Structure and Properties (SAP) Transformations (TRA) |
| Primary Learning Objectives |
TRA-1.D: Explain the relationship between macroscopic characteristics and bond interactions for: TRA-1.C: Represent a given chemical reaction or physical process with a consistent particulate model. |
| Secondary Learning Objective |
SAP-5.B: Explain the relationship between the macroscopic properties of a substance, the particulate-level structure of the substance, and the interactions between those particles. |
| Science Practices | 4.B, 4.D, 6.B, 6.D, 6.E, 4.B, 4.D |
What Does Acid Rain Do to Coral Reefs?
In this lab, students investigate the factors that affect reaction rates of calcium carbonate decomposition in the presence of acid, one of the underlying mechanisms of coral reef bleaching.
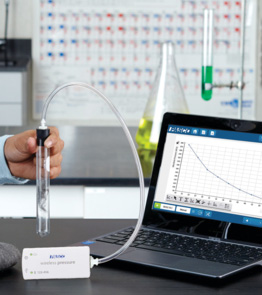
In the initial investigation, students use a Wireless Pressure Sensor to monitor the chemical reaction between calcium carbonate and hydrochloric acid. They use the resulting plot of Pressure (kPa) vs. Time (s) to answer analysis questions, determine the limiting reactant, and calculate the theoretical number of moles of CO2 produced from the reaction.
In the advanced investigation, students repeat the procedure under varying conditions to investigate the factors that affect the reaction rate, including acid concentration and surface area. They use their results to answer analysis questions and design an experiment to determine other factors that may affect the rate of decomposition.
| Boilerplate | Students use a pressure sensor to study factors that affect the reaction of calcium carbonate with acid. |
| Prerequisite Concepts | Kinetics, reaction rates, reaction order, gas laws, acid-base reactions, environmental chemistry |
| Big Ideas | Transformations (TRA) |
| Primary Learning Objective |
TRA-3.A: Explain the relationship between the rate of a chemical reaction and experimental parameters. |
| Secondary Learning Objective |
TRA-3.C: Identify the rate law of a chemical reaction concentration of reaction species change over time. |
| Science Practices | 2.A, 2.B, 2.C, 2.D, 2.F, 4.D, 5.D, 6.A, 6.B, 6.D, 6.E, 6.F |
Teaching Tools
Wireless Pressure Sensor
Enhance studies of gas laws, reaction rates, and more with real-time data from the Wireless Pressure Sensor.
Kinetics of Crystal Violet Fading
In this lab, students determine the reaction order of crystal violet fading in the presence of sodium hydroxide using either a Wireless Spectrometer or a Wireless Colorimeter. Separate versions of this experiment are provided for each method.
| Boilerplate | Students determine the reaction order of crystal violet fading in the presence of sodium hydroxide using a spectrometer or colorimeter. |
| Prerequisite Concepts | Kinetics, rate law, reaction rate, reaction order, spectrometry, Beer’s law, kinetic molecular theory |
| Big Ideas | Transformations (TRA) |
| Primary Learning Objectives |
TRA-3.B: Represent experimental data with a consistent rate law expression. TRA-3.C: Identify the rate law of a chemical reaction concentration of reaction species change over time. |
| Secondary Learning Objective |
TRA-3.A: Explain the relationship between the rate of a chemical reaction and experimental parameters. |
| Science Practices | 2.C, 4.B, 4.D, 5.A, 5.B, 5.D, 6.A, 6.B |
Teaching Tools
Wireless Spectrometer
Discover the benefits of teaching with a student-friendly spectrometer designed for your needs. Study absorbance and transmission, Beer’s law, kinetics, and more!Building a Better Hand Warmer
In this lab, students become innovators as they use calorimetry to investigate potential compounds for use in commercial hand warmers.
The initial investigation helps familiarize students with calorimetry by having them determine the heat capacity of the system. After tracking changes in temperature, students perform calculations to determine the net temperature change, change in enthalpy, and calorimeter constant. They then repeat the process using magnesium sulfate instead of water.
In the advanced investigation, students are given a list of ionic solids and criteria for designing their hand warmers. They work together to design and implement experiments to determine the heat of solution for each solid. The results from the calorimetry experiments are combined in a table and used to calculate changes in energy and enthalpy. Students analyze their data, along with a chart of compound costs, to determine which compound best suits the needs of the hand warmer design.
| Boilerplate | Students use a temperature sensor to determine the heat of solutions of a number of ionic compounds and propose a practical hand warmer design. |
| Prerequisite Concepts | Enthalpy, calorimetry, specific heat, heat of solution, exothermic reactions, endothermic reactions, entropy, system and surroundings |
| Big Ideas | Energy (ENE) |
| Primary Learning Objectives |
ENE-2.D: Calculate the heat q absorbed or released by a system undergoing heating/cooling based on the amount of the substance, the heat capacity and the change in temperature. ENE-2.E: Explain changes in the heat q absorbed or released by a system undergoing phase transition based on the amount of the substance in moles and the molar enthalpy of the phase transition. ENE-2.F: Calculate the heat q absorbed or released by a system undergoing a chemical reaction in relationship to the amount of the reacting substance in moles and the molar enthalpy of reaction. |
| Secondary Learning Objective |
NA for this activity. |
| Science Practices | 2.C, 4.B, 4.D, 5.A, 5.E, 5.D, 5.F, 6.A, 6.B, 6.F |
Teaching Tools
Wireless Temperature Sensor
Stream live temperature data to virtually any device with the Wireless Temperature Sensor.Applications of Le Châtelier’s Principle
This lab introduces students to several representations of systems in equilibrium to help them conceptualize Le Châtelier’s principle.
In the initial investigation, students monitor the reaction between iron (III) nitrate and potassium thiocyanate using a Wireless Colorimeter. They compare the color and molarity of each reactant with the color and absorbance of the product, determine the initial concentration of SCN- ions in the mixture, and complete an ICE table to calculate the equilibrium constant.
In the advanced investigation, students explore the effects of adding stress to a system in equilibria. They perform three separate reactions, record their observations, and describe the state of the solution equilibrium under various conditions.
Next, students use their results to predict how adding or removing each reactant would impact the color, direction, and Q and Kc of the system. Lastly, students observe a cobalt equilibrium system under heat stress and determine whether it is endothermic or exothermic.
| Boilerplate | Students study equilibrium and the reversibility of chemical reactions using colorimetry and energy changes. |
| Prerequisite Concepts | Equilibrium, equilibrium constant (Kc), Le Châtelier’s principle, reaction quotient (Q), ICE table, favorability, equilibria |
| Big Ideas | Transformations (TRA) |
| Primary Learning Objectives |
TRA-8.A: Identify the response of a system at equilibrium to an external stress, using Le Châtelier’s principle. TRA-8.B: Explain the relationship between Q, K and the direction in which a reversible reaction will proceed to reach equilibrium. |
| Secondary Learning Objective |
NA for this activity. |
| Science Practices | 2.C, 2.D, 5.D, 6.A, 6.B, 6.F |
Teaching Tools
Wireless Colorimeter and Turbidity Sensor
Facilitate hands-on studies of water quality, chemical equilibrium, and more with the Wireless Colorimeter and Turbidity Sensor.Investigation of Acid-Base Titrations
This lab introduces students to the different types of acid-base titrations, including those involving strong acids and strong bases, weak acids and strong bases, and two weak acids.
For the initial investigation, students titrate hydrochloric acid with sodium hydroxide. They use a pH Sensor and a Wireless Drop Counter to monitor their titration curve in real time, note the equivalence point, and stop the reaction once the endpoint is reached. Students use their observations and titration curves to perform calculations and answer questions.
In the advanced investigation, students titrate the weak acid, acetic acid, with the strong base, sodium hydroxide. They use the same method as before to collect data, balance the chemical equation for the reaction, and answer analysis questions.
Next, students perform a titration using maleic acid, a weak polyprotic acid, and sodium hydroxide, a strong base. The same methods are used once more to collect data, and students move on to calculate solutions to the analysis questions.
| Boilerplate | Students compare the titration profiles of strong, weak, and polyprotic acids. |
| Prerequisite Concepts | Titration, strong and weak acids, mono- and polyprotic acids, equivalence point, Ka expressions, pH, pOH, neutralization reactions |
| Big Ideas |
Scale, Proportion, Quantity (SPQ) Structure and Properties (SAP) Transformations (TRA) |
| Primary Learning Objective |
SAP-9.E: Explain results from the titration of a mono- or polyprotic acid or base solution, in relation to the properties of the solution and its components. |
| Secondary Learning Objectives |
TRA-1.B: Represent changes in matter with a balanced chemical or net ionic equation: SPQ-4.B: Identify the equivalence point in a titration based on the amounts of the titrant and analyte, assuming the titration reaction goes to completion. TRA-8.A: Identify the response of a system at equilibrium to an external stress, using Le Châtelier's principle. |
| Science Practices | 1.A, 1.B, 2.A, 2.B, 2.C, 2.D, 2.F, 3.A, 3.B, 3.C, 4.B, 4.D, 5.A, 5.B, 5.C, 5.D, 5.E, 6.B, 6.D, 6.F |
Introduction to Buffers
This lab introduces students to buffers and buffering systems using a combination of reactions and particle modeling.
In the initial investigation, students use a pH Sensor to determine whether adding sodium acetate to acetic acid causes a change in the solution pH. They answer questions to reinforce their understanding of solution equilibrium, chemical dissociation, and chemical interactions.
In the advanced investigation, students measure the pH of several solutions and solution mixtures. Next, they add sodium hydroxide to each sample and record the observed pH change. Students use their observations and dataset to determine which solutions are buffers and answer analysis questions.
Lastly, students determine the buffering capacity of Bufferin™. They create two solutions: one containing dissolved Aspirin and one containing dissolved Bufferin™. Students compare the pH of the solutions and answer analysis questions.
| Boilerplate | Students use titration and pH to investigate the components of a buffer and how it acts to resist changes in pH. |
| Prerequisite Concepts | Buffer, acid-base reactions, equilibrium, Le Châtelier’s principle, Ka and pKa expressions, weak acids and bases, conjugate acids and bases, buffer capacity |
| Big Ideas |
Scale, Proportion, Quantity (SPQ) Structure and Properties (SAP) Transformations (TRA) |
| Primary Learning Objectives |
SAP-10.B: Explain the relationship between the ability of a buffer to stabilize pH and the reactions that occur when an acid or a base is added to a buffered solution. TRA-1.C: Represent a given chemical reaction or physical process with a consistent particulate model. |
| Secondary Learning Objectives |
SPQ-4.B: Identify the equivalence point in a titration based on the amounts of the titrant and analyte, assuming the titration reaction goes to completion. SAP-5.B: Explain the relationship between the macroscopic properties of a substance, the particulate-level structure of the substance, and the interactions between those particles. |
| Science Practices | 2.C, 2.D, 2.F, 5.D, 6.B, 6.C, 6.D, 6.E, 6.F |
Evaluation of Lemonade as a Buffer (Buffer Design)
In this lab, students learn about the food industry’s use of buffers and investigate the buffering capacity of a common brand of lemonade mix.
In the initial investigation, students titrate citric acid with sodium hydroxide. They use a Wireless pH Sensor and Wireless Drop Counter to generate a live titration curve and save it for later. Then they repeat the procedure using lemonade as the titrant. Students plot a copy of their curves to compare them and answer analysis questions.
In the advanced investigation, students build on what they’ve learned by designing an experiment to determine whether the concentration of the lemonade affects the shape of the titration curve. Students put their experiment to the test by comparing the titration curves produced when the concentration of the lemonade is varied by 1X. Lastly, they design an experiment that would allow them to determine the buffering capacity of different drink mixes using titration curves.
| Boilerplate | Students use a commercial lemonade formulation as a model for buffers and test its capacity to resist pH changes. |
| Prerequisite Concepts | Buffer, buffer capacity, pH, dissociation constant, weak acids and bases, conjugate acids and bases, Ka and pKa |
| Big Ideas |
Scale, Proportion, Quantity (SPQ) Structure and Properties (SAP) |
| Primary Learning Objective |
SAP-10.D: Explain the relationship between the buffer capacity of a solution and the relative concentrations of conjugate acid and conjugate base components of the solution. |
| Secondary Learning Objective |
SPQ-1.A: Calculate quantities of a substance or its relative number of particles using dimensional analysis and the mole concept. |
| Science Practices | 2.C, 2.D, 2.E, 2.F, 4.B, 4.D, 5.A, 5.E, 5.F, 6.A, 6.B, 6.F |

