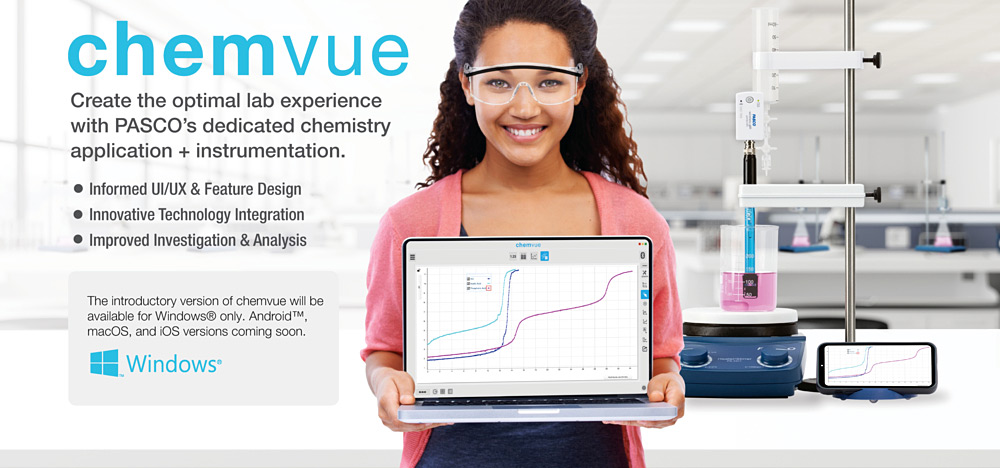
Chemvue is an intuitively designed software for chemistry investigations, programmed with input from faculty for college lab student success. It enables convenient data collection and analysis, elegant college lab report design, and easy export options. Coming soon to your local device.
We’re looking for University/College chemistry instructors and lab managers to try Chemvue and provide feedback.
Your expertise can shape the future of Chemvue! Follow this link to sign up and join our Chemvue preview group, and feel free to provide feedback using the link within the software.
Register to Preview ChemvueAlready have Chemvue? Interact with a free sample data set!
Download free sample data sets (descriptions below) to analyze and edit on your own! We collected the data here at PASCO, so all you have to do is open the file in Chemvue and begin investigating.
Evaporative Cooling
Explore evaporative cooling rates of methanol, ethanol, and propanol. (Data collected using our Wireless Temperature Sensor.)
Boyle's Law
Investigate how gas responds when the volume of its container changes. (Data measured with our Wireless Pressure Sensor.)
Titration Curves
Compare titration curves of various strong and weak acids. (Volume measured using our Wireless Drop Counter.)
Why Chemvue?
Informed UI/UX & Feature Design:
Designed in collaboration with college chemistry professors.
Innovative Technology Integration:
Engineered with state-of-the-art data collection and lab reporting.
Improved Investigation & Analysis:
Envisioned to improve lab efficiencies and student learning.
Our new chemistry application is built with your needs in mind. Measurements begin instantaneously upon pairing sensors to give students immediate digital readouts of the phenomenon they are measuring. The reported units communicate significant figures correctly, and units can be easily converted by a menu drop-down option.
Chemvue has three methods of data input:
- Capture real-time measurements from sensors
- User-entered data
- Calculations on column data. Analysis calculations allow for finding slope, best fit, area under the curve, and count of events measured in the selection. Communicate your measurements clearly with labels, annotations, and customizable column titles.
Chemvue is compatible with PASCO’s award-winning line of chemistry sensing equipment.
Students can:
- Measure ion concentrations in solution
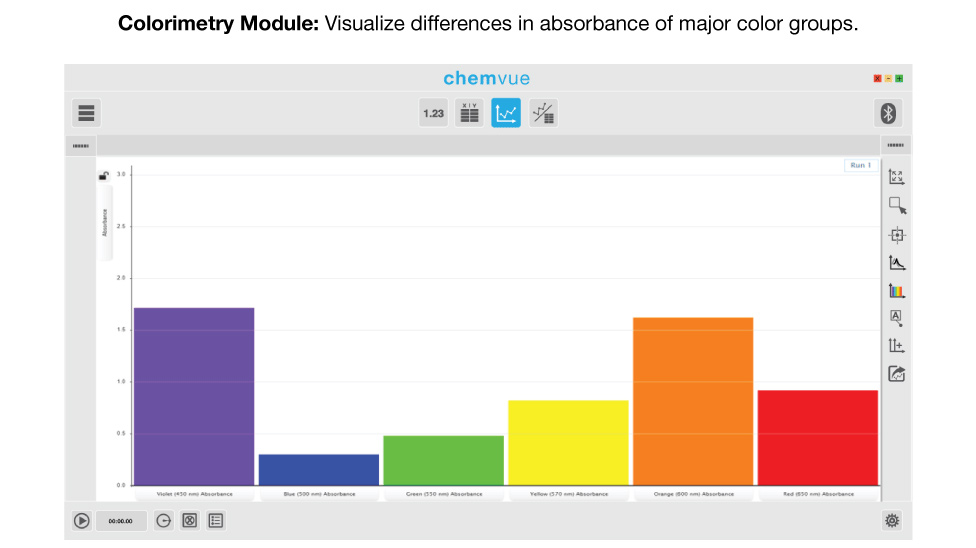
- Determine reaction kinetics by color changes
- Monitor gas pressure concurrently with volume or temperature changes
- Log solution volumes to find acid-base strengths
- Determine solution potentials from their electric potentials
- Track battery capacity following current levels
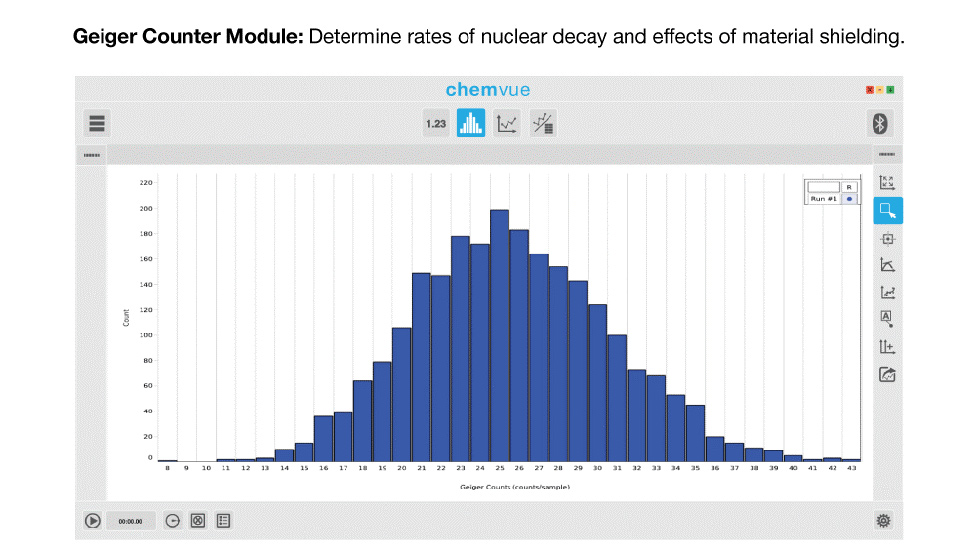
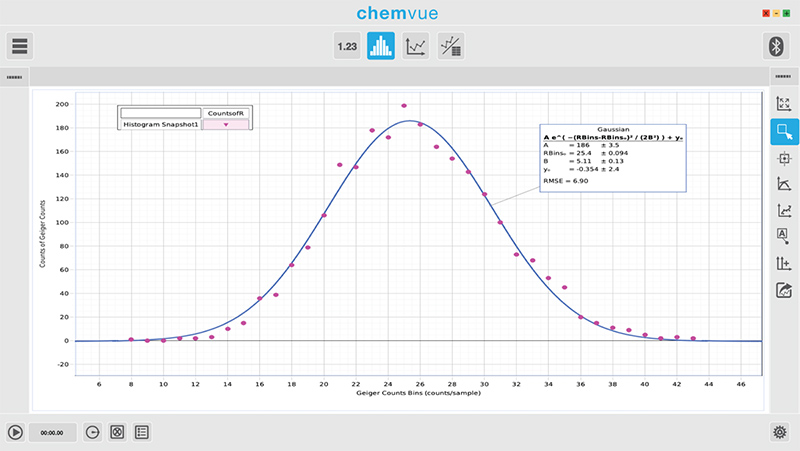
- Investigate nuclear probabilities measuring rates of decay from unstable isotopes
- And much more
The introductory version of Chemvue will be available for Windows only, with Android, macOS, and iOS versions coming with full release.
Features
With features designed specifically for chemistry courses, this interface simplifies workflow to maximize student efficiency during lab time.
- Auto-Configuration
- Calibration
- Calculator
- Number Formatter
- Sampling Options
- Export Options
- Dark Mode
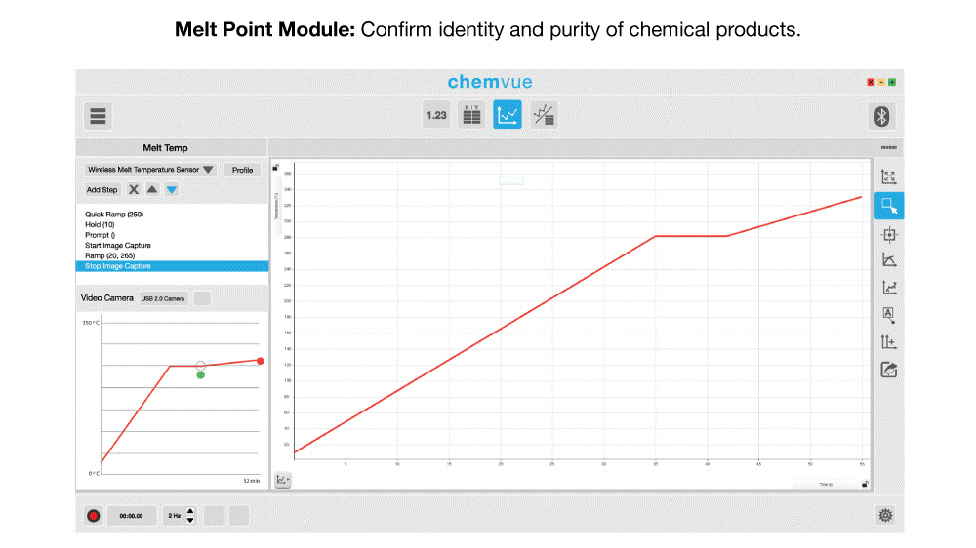
Chemvue recognizes and auto-configures an appropriate page setup based on the device you connect. Did you connect PASCO’s Wireless pH Sensor and Drop Counter? Chemvue recognizes you want to run a titration. Auto-configuration also applies to our spectrometers, colorimeter, Geiger counter, and melt point apparatus.
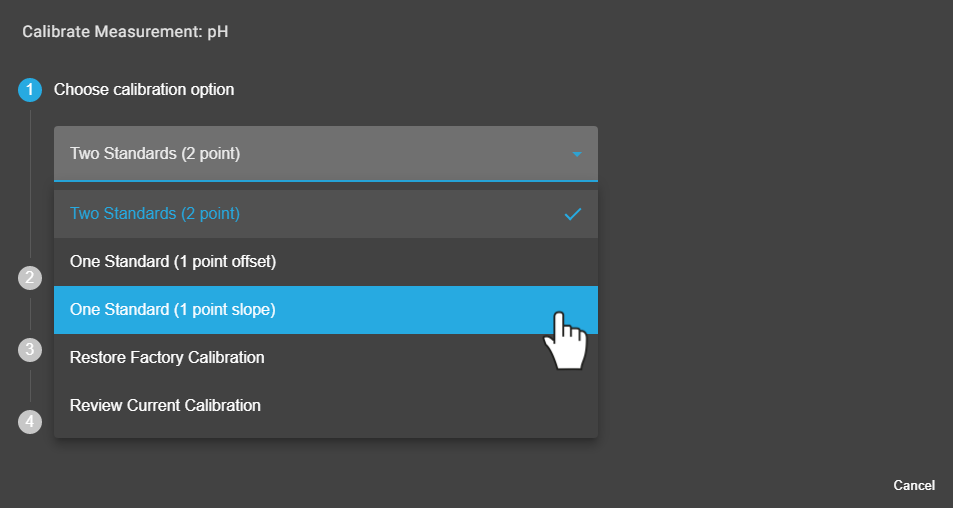
Calibration can easily be set via the measurement dropdown menu from the digital display, graph axes, or table headings when sensors are connected.
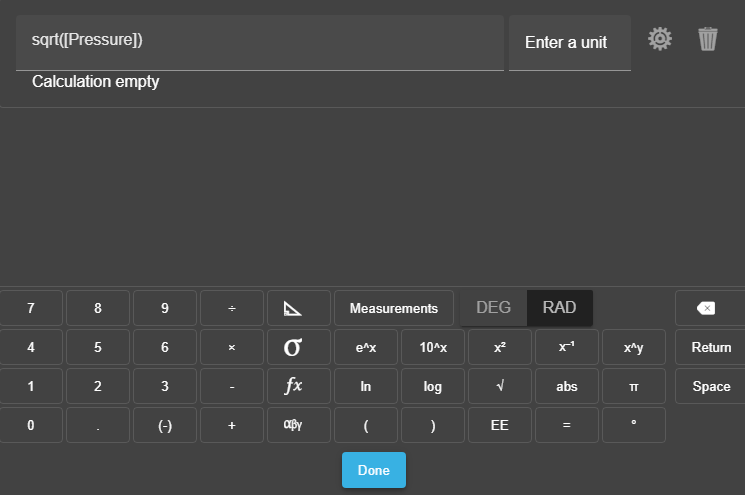
Use existing data points to calculate new meaningful values, manipulate data to show linear relationships, or convert measurement units.
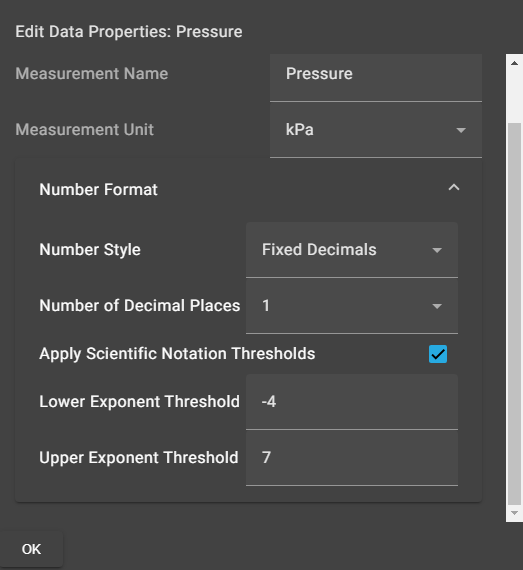
Choose significant figures, fixed decimal places, or scientific notation to display your data and edit them anytime.
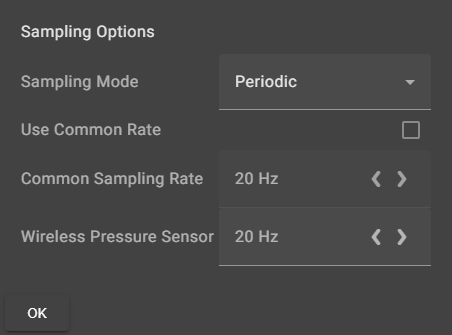
Choose from a wide range of sampling intervals for data point collection to fit your experimental needs.
Promote student collaboration with export options at the click of a button. Chemvue supports the sharing of CSV data and PNG images, allowing students to share, analyze, and write up their labs on any device with any software.
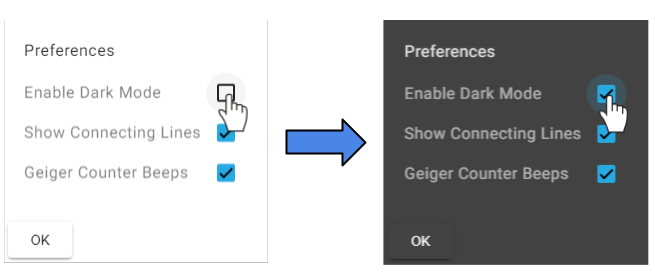
Reduce eye fatigue and make your data stand out with Dark Mode; toggle between modes while using the software, and export screenshots with light or dark backgrounds–perfect for presentations.
How Do I? Videos
Follow along with the Chemvue “How Do I?” YouTube tutorial videos to easily navigate Chemvue’s features and displays.
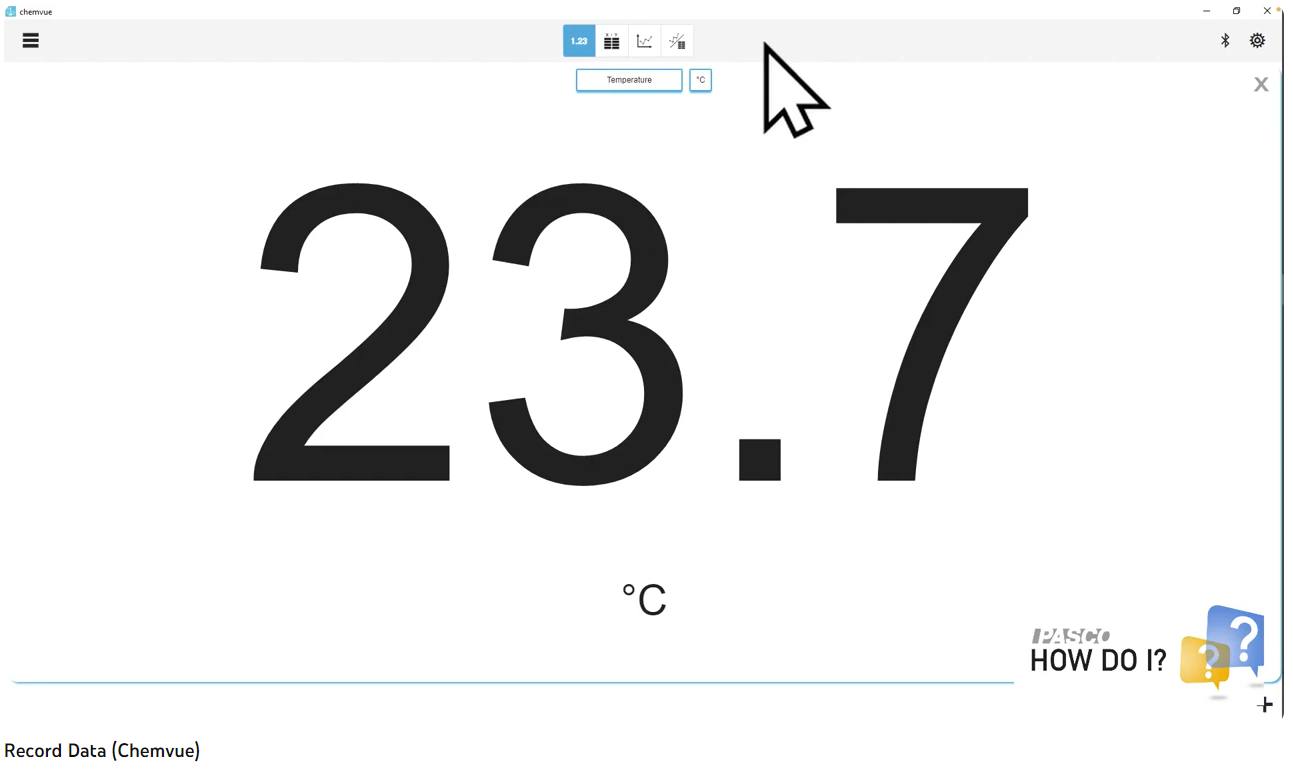 Record Data
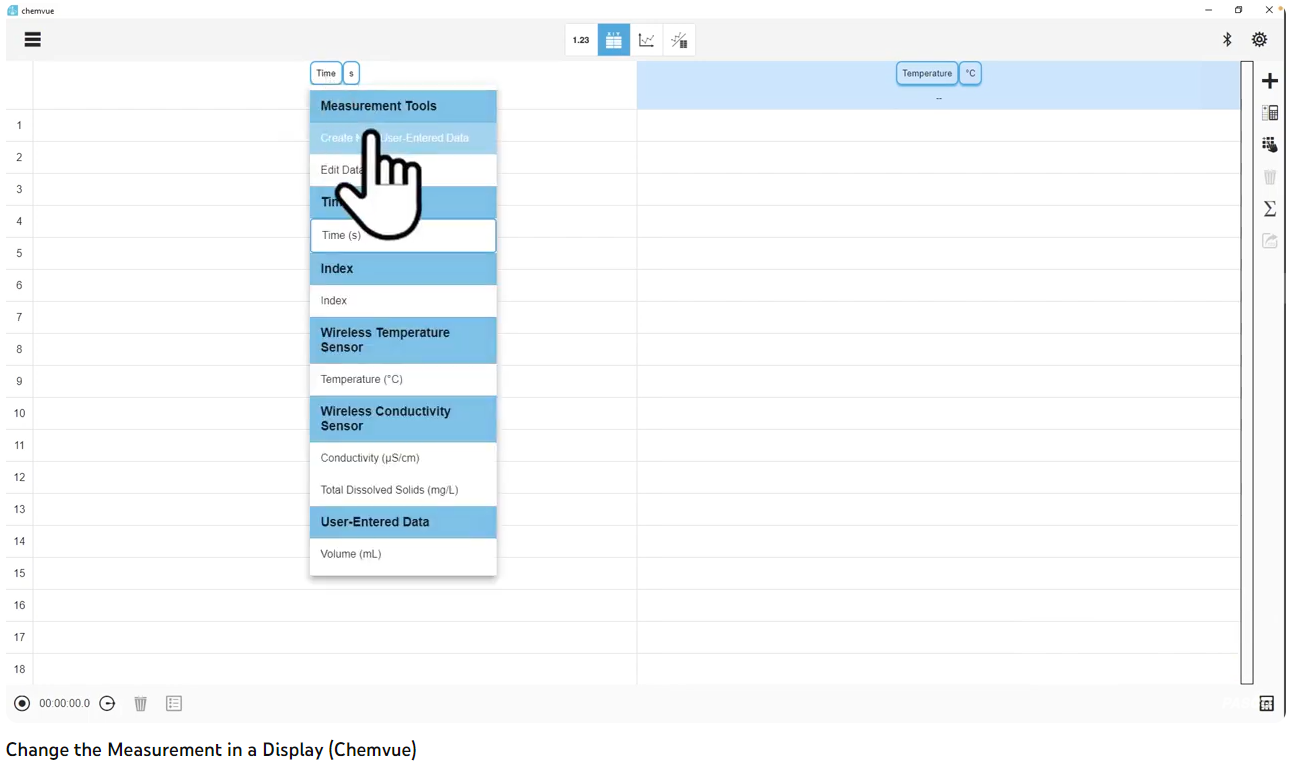 Change the Measurement in a Display
Chemvue Video Playlist
For many more Chemvue "How Do I?" tutorial videos, click the button below.Take me to the Playlist
Chemvue Experiments
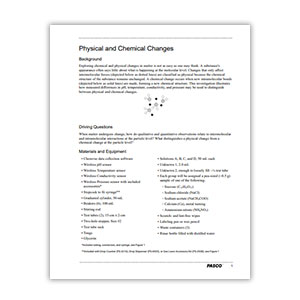
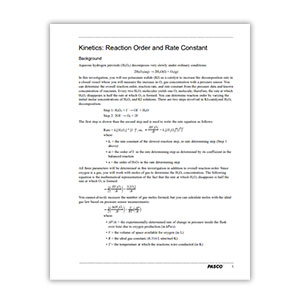
Explore these college-level General Chemistry lab activities designed to work with Chemvue software.
Chemvue Labs for College Chemistry
Coming Soon!
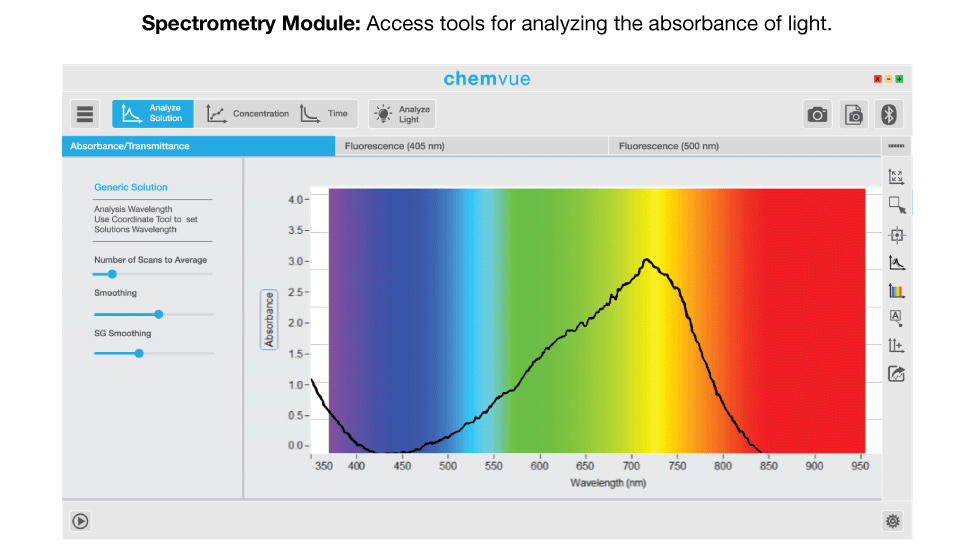
- Modules
- Visual Statistics
- Run Color/Symbol Management
- Outlier Management
- Error Bars
- Binning
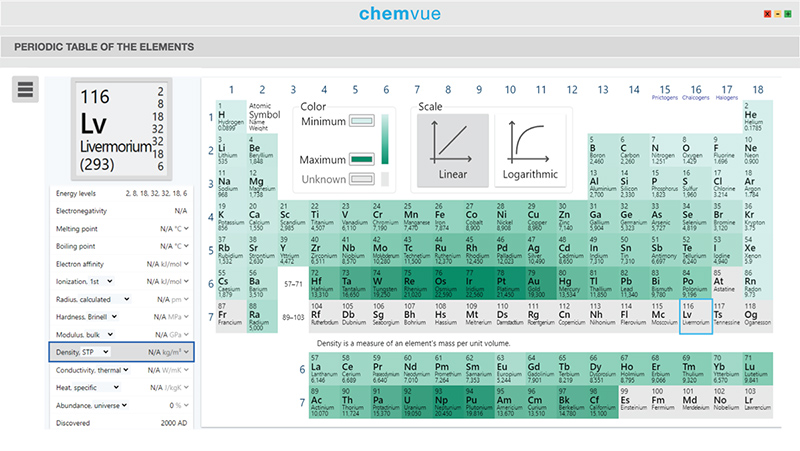
- Interactive Periodic Table
- Equation Balancer
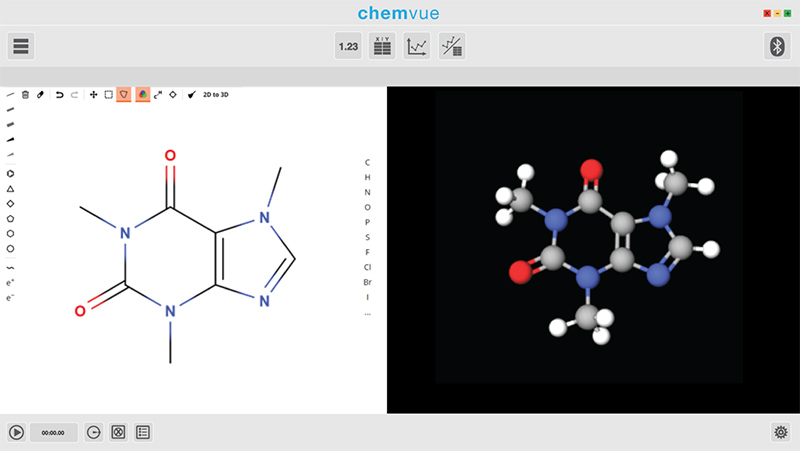
- Molecular Viewer
Shade portions of your selection to show standard statistics.
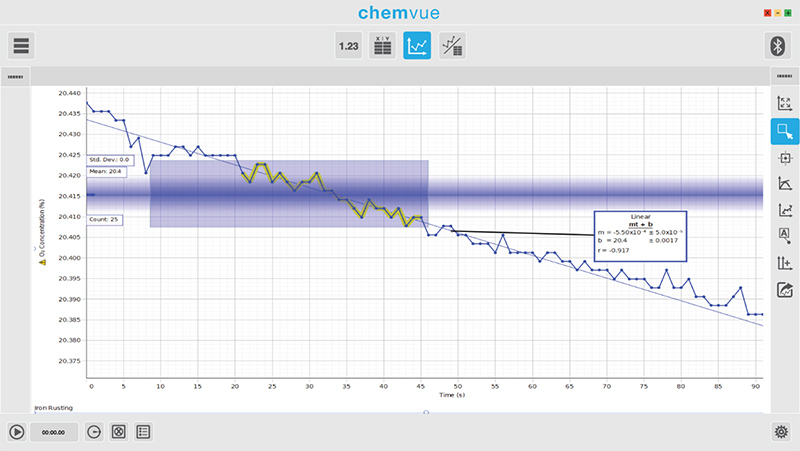
Choose the symbol and color of your run data points.
Remove unwanted data points from your run.
Determine the variation of your data based on the sensor or a calculated column.
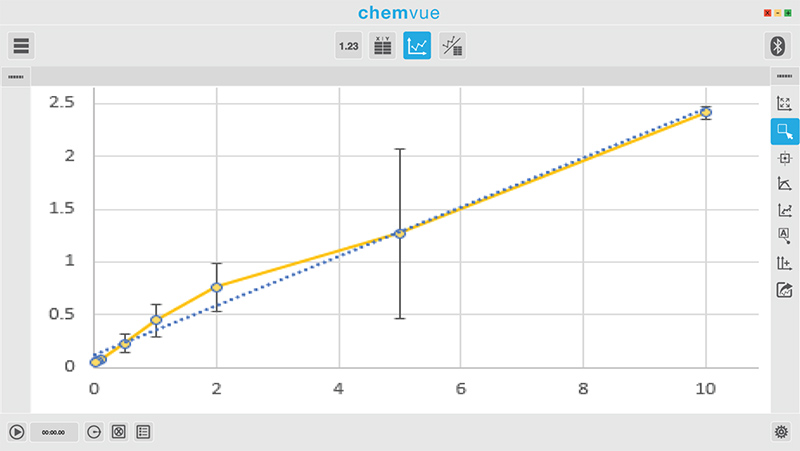
Show patterns more easily in variable data.
See patterns for elements in the periodic table quickly.
Tool to assist students in balancing chemical formulas.
3D-model viewing function.
Data Collection
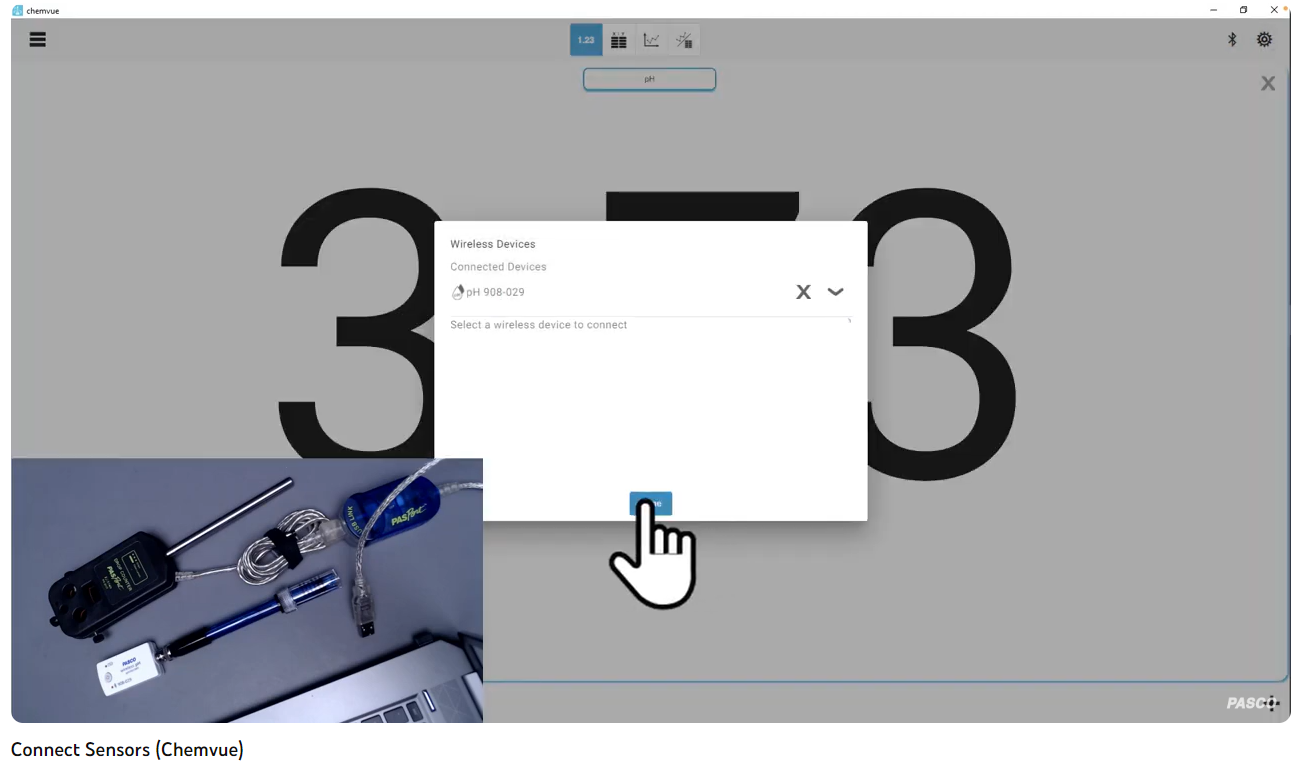
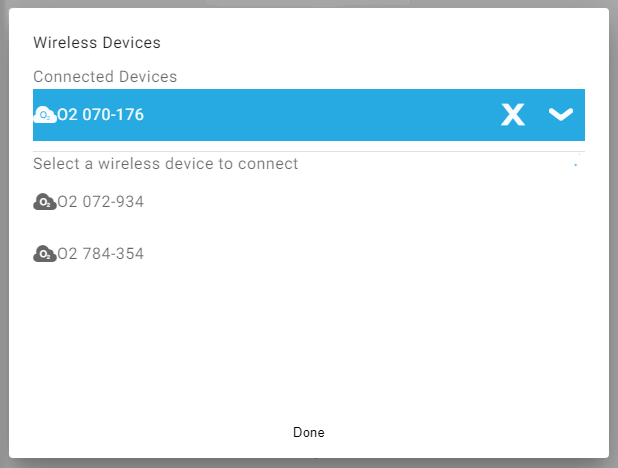
Connect to a PASCO sensor wirelessly or using a USB cable. Chemvue utilizes the newest Bluetooth® technology, and wireless sensors pair through a simple in-app list so no system settings are required. With multiple sensors in most labs, easily connect the correct sensor from a proximity sorted list of sensors (6-digit laser-etched ID number).

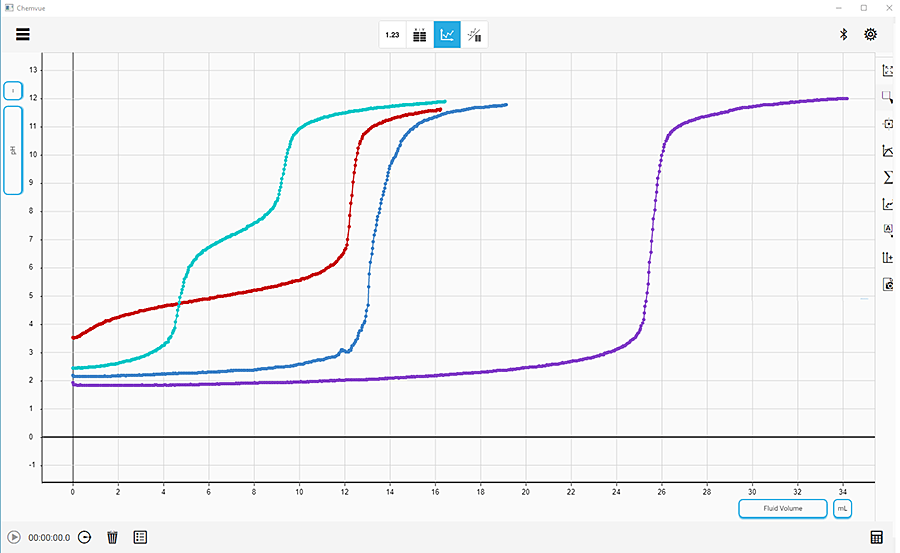
Comparing titrations of several acids helps students understand how concentration, strength and polyprotism impact curve shape and location.
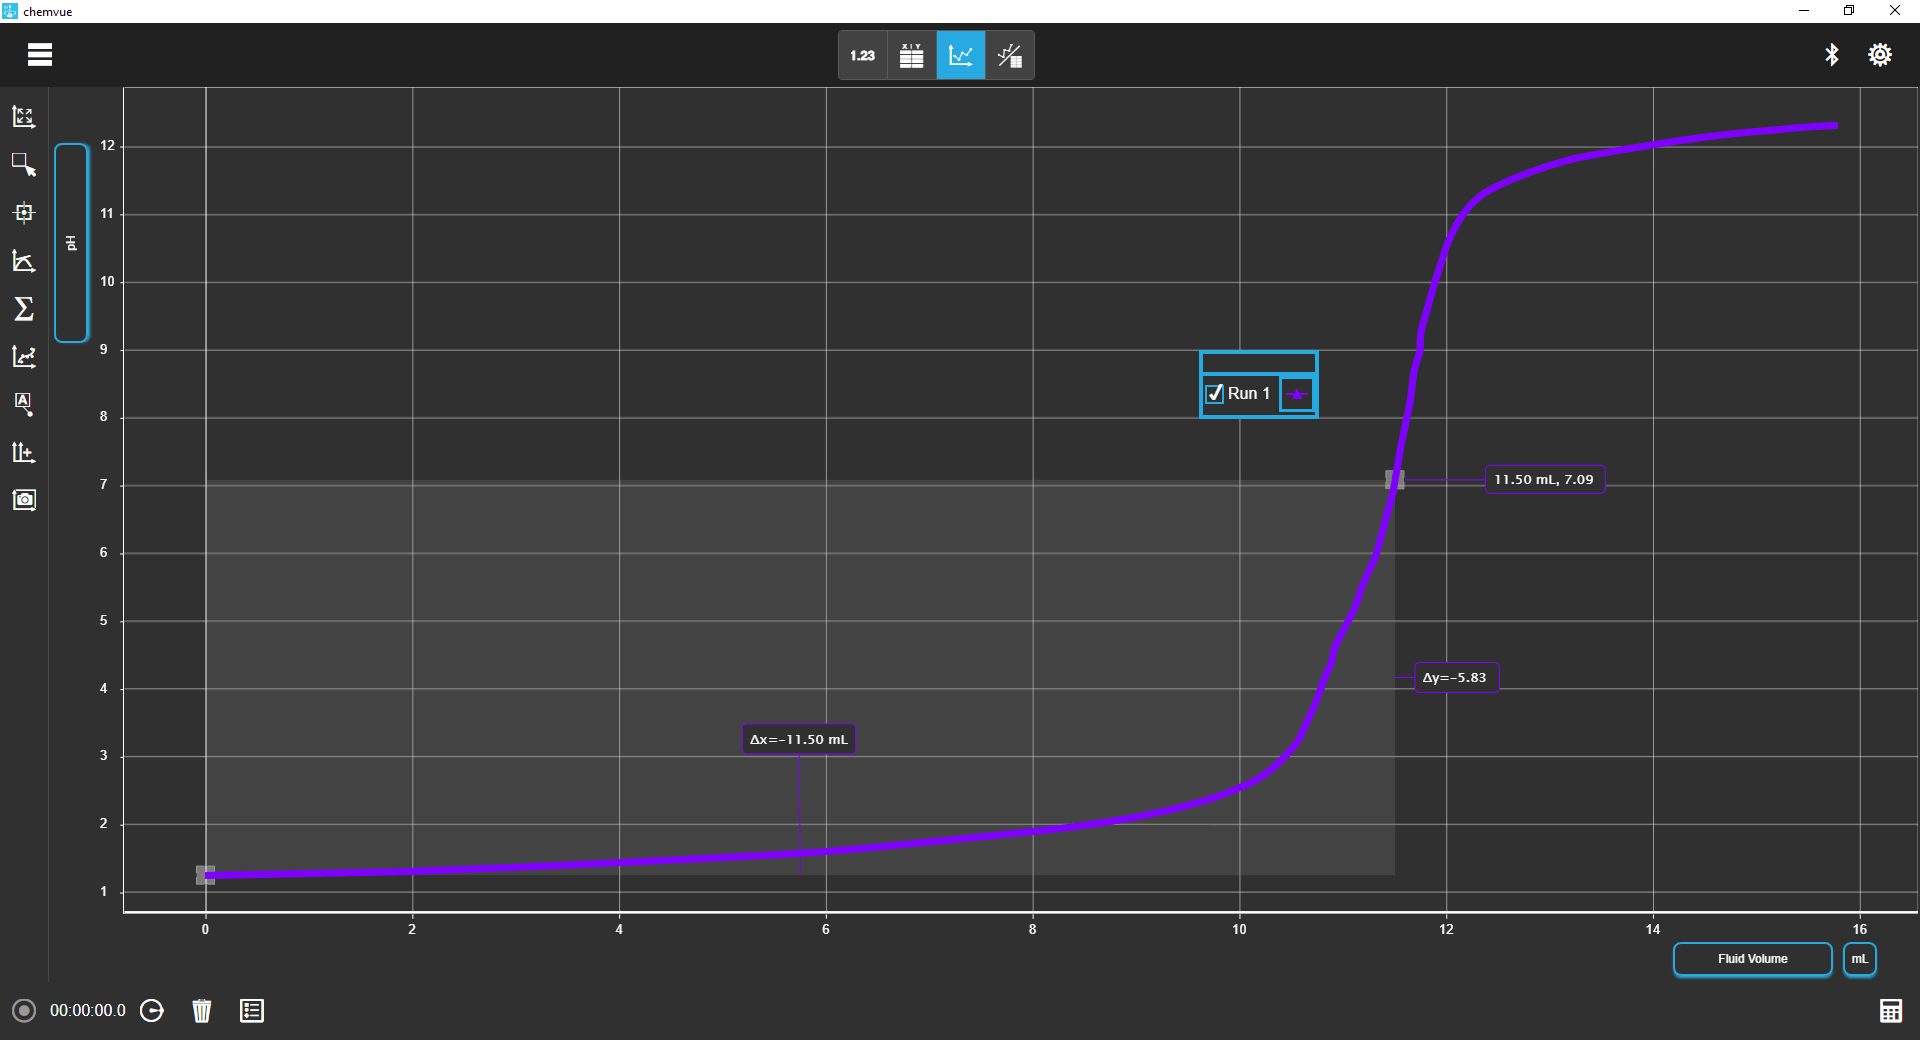
Titration graph showing pH vs. Volume as titrant is added to solution.
Immediately choose from dozens of sensed properties based on which instrument is connected: Temperature, pressure, mass, conductivity, light absorption, gas concentrations (O2, CO2, and ethanol), voltage, current, pH, ion selective electrodes, radiation, sound, humidity and atmospheric conditions. The list of possibilities grows as tools are added to the PASCO line! Easily connect to Chemvue and start capturing values to record on your device for further analysis.
Select regions on your graph to compare values, interpolate data, and explore formulas that best describe the relationship between the variables. Use tools like tangent lines to determine reaction rates, and calculate the area under the curve to determine how much has reacted.
Easily stretch axes scale your graph, drag your graph to areas of interest, or select and zoom in to magnify data points. In-context tools make it simple to find what you’re looking for, which means that students spend their time learning the science, not the software.
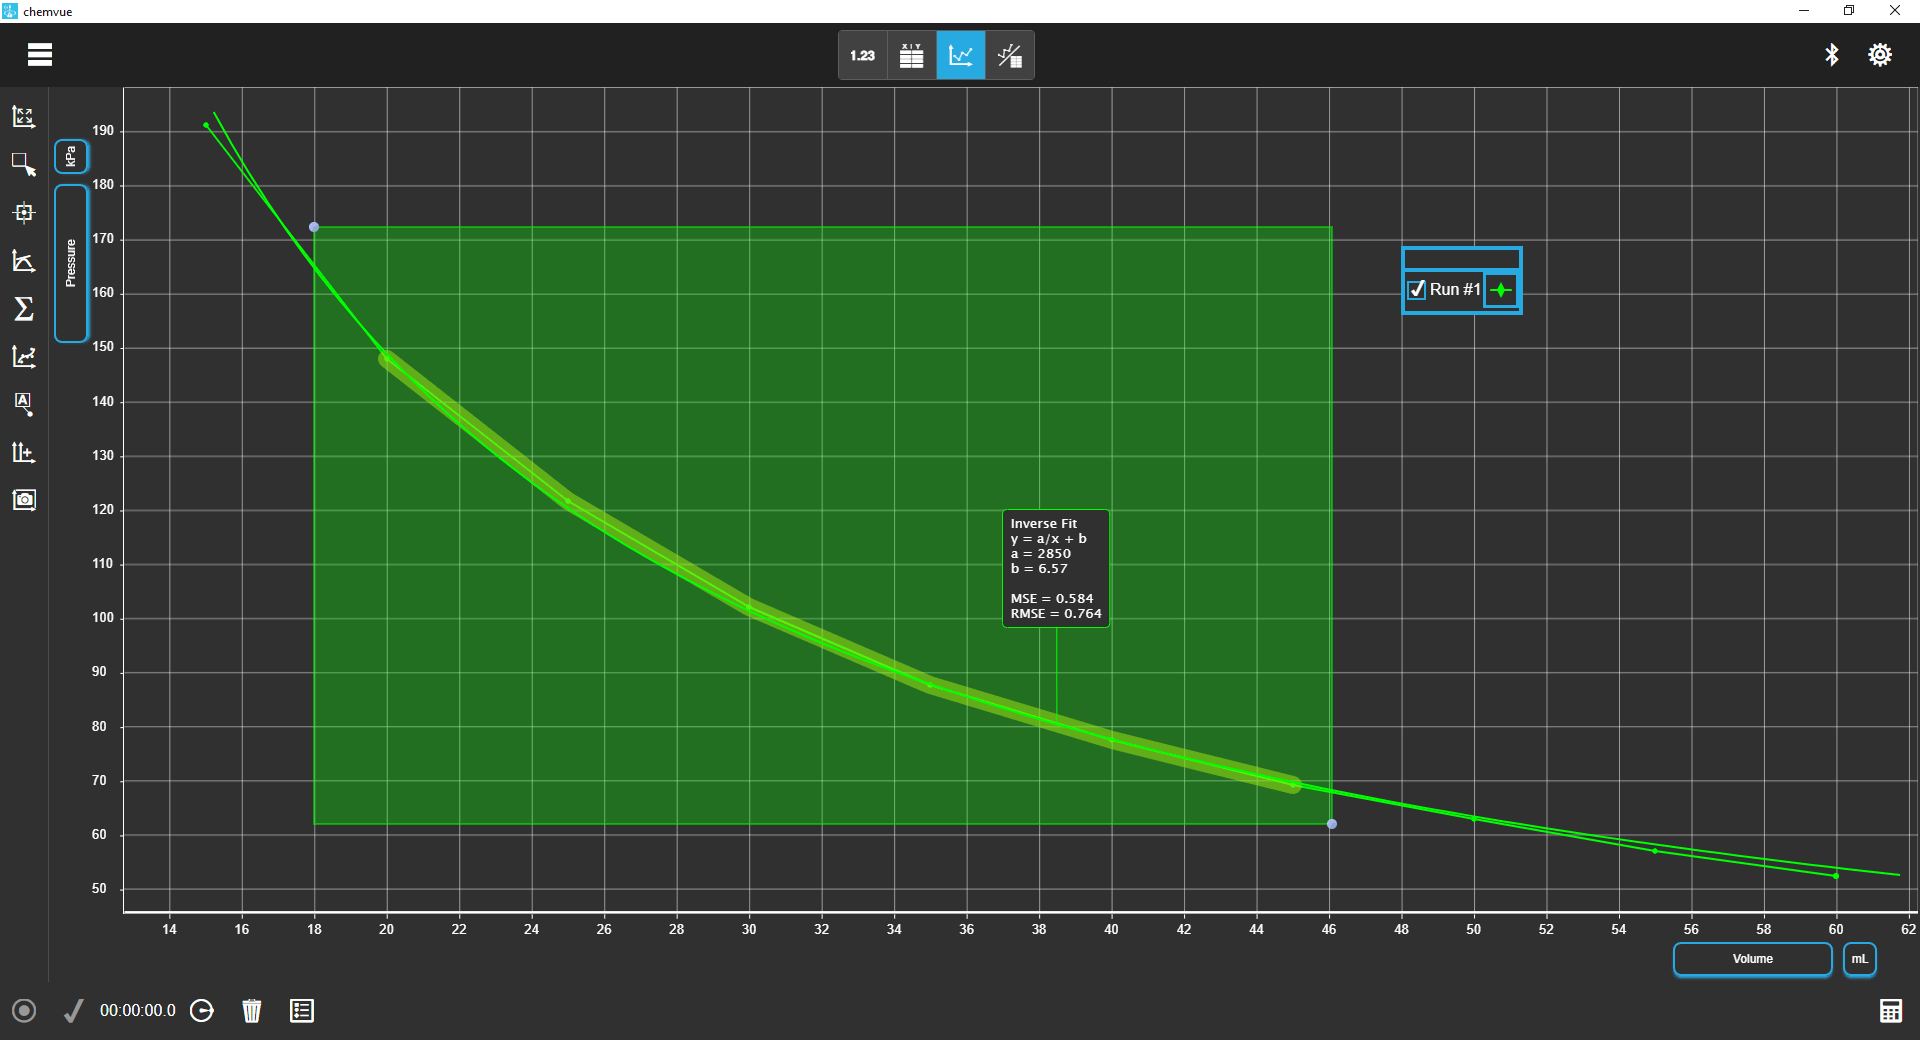
Boyles Law showing relationship between volume and pressure of a contained gas.
Data Sharing and Export
When it’s time for students to submit their work, students can easily export an image of their graph, export the data to a .csv file to work in a spreadsheet, or save it in our Chemvue format. This file can be shared by email or sent via bluetooth (whatever your device supports) back to themselves to design their lab write-ups.


